


In the evolving landscape of pharmaceutical research and development, the goal to understand the micro and nanoscale properties of therapeutics is vital. Central to this pursuit is the deployment of advanced imaging technologies such as scanning electron microscopy (SEM) – a cornerstone technique implemented across many science and engineering disciplines for morphological and topographical analysis of materials. The method functions by having a focused electron beam raster scan across the surface of a sample in a vacuum, yielding several electron signals that are detected and processed to form a magnified image. In addition to imaging, X-rays that are emitted during a raster scan permit the study of elemental composition makeups with SEM; this process is aptly called energy-dispersive X-ray spectroscopy (EDS). When combined, the two techniques offer a vast, comprehensive amount of insight into a sample.
SEM analysis allows scientists to optimize drug formulations by providing robust particle characterization that combines size measurements with the elemental composition of individual particles. This information is essential for understanding active pharmaceutical ingredient (API) distributions and identifying trace impurities that can pose quality and safety risks. Its versatile imaging capabilities can also be leveraged for observing pharmaceutical ingredients over time to elucidate the nanoscale mechanisms of controlled-release drug delivery systems and assess stability. Furthermore, the technique plays a critical role in the development of drug-delivery devices by serving as a tool for quality control and failure analysis.

Particle Morphology Characterization
Characterizing the size, shape, and surface morphology of pharmaceutical powders is critical for optimizing and maintaining the clinical effectiveness of many types of drug products. Smaller particles – owing to their high specific surface area – are associated with faster dissolution rates. Size distribution within a batch of drug material is a key quality indicator of manufacturing processes. A batch with uniform particle size distribution is often the gold standard, as it ensures consistent drug release and uniform dosing in products. Variations, however, can lead to clinical differences in how the drug is absorbed and metabolized in the body. On the other hand, understanding how particle morphology impacts flow and packing properties is essential for optimizing drug formulations. For instance, needle-like crystals may have poorer flow properties compared to more spherical particles. As a result, analyzing particle shape helps in selecting the most appropriate formulation and manufacturing processes.
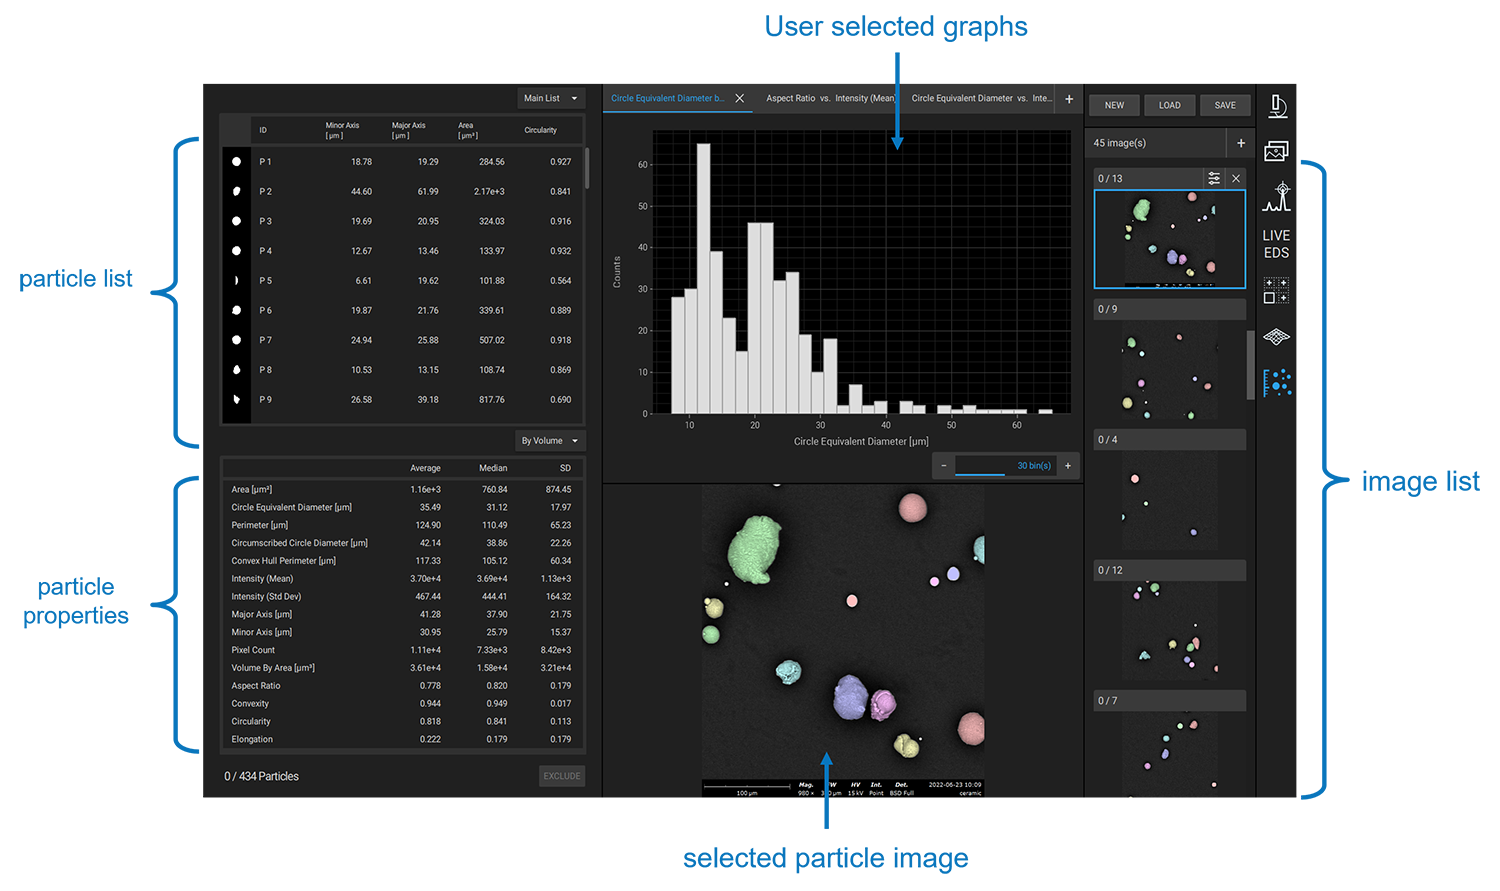
SEM solutions such as the Phenom ParticleX automated particle analysis system – allow for rapid detection of particle size variations through automated high-resolution imaging. ParticleX is also a statistically comprehensive tool, collecting geometrical and elemental data on hundreds or thousands of individual particles and compiling results in accessible reports, graphs, and tables for end-use. Figure 1 conveys this concept with a snippet of the Phenom UI – particle images, properties, and user-selected charts are all displayed.
API Distribution in Drug Formulations
APIs in their pure form often lack suitable bioavailability and pharmacokinetics, necessitating the use of additional inert ingredients. Therefore, effectively incorporating APIs into formulations like tablets, capsules, emulsions, gels, and patches with excipients is necessary for enhancing bioavailability. The specific choice and ratio of excipients depends on factors like API solubility, dosage form, release kinetics, and the method with which the drug is administered.
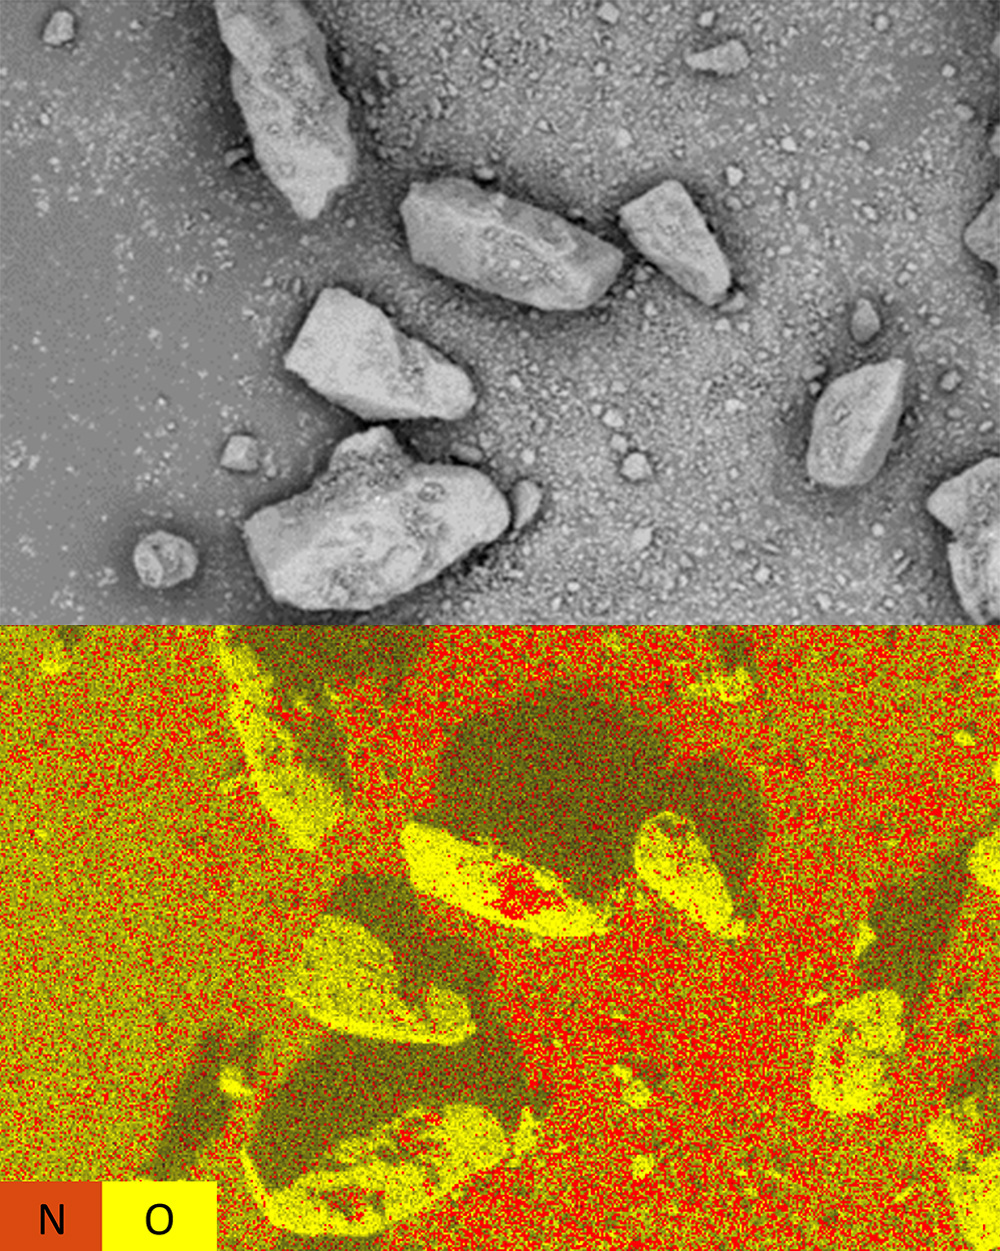
Drug manufacturers rely on high-resolution imaging and spectroscopy to analyze the formulations at the micro and nanoscales. SEM with integrated EDS provides detailed surface imaging and compositional mapping of particles, intermediates, and final drug products. The example in Figure 2 shows the adhesion balance of a dry powder inhaler API. Comparing the SEM image to the EDS map shows that the nitrogen-rich API does not concentrate on smooth and convex surface areas as much as it does on the concave areas of the excipient. Gaining insight into the surface morphology of the excipient particles is therefore immensely valuable to assess the degree of API binding through interaction mechanisms.
Trace Impurity Detection
Ensuring the purity of drug formulations is critical for both patient safety and efficacy. Trace quantities of inorganic impurities may be introduced from raw materials, packaging interactions, and processes like milling and blending in the form of metals or organic compounds. Even at low concentration levels, contaminants can significantly alter drug stability and clinical outcomes. Sensitive analytical techniques such as SEM & EDS are thus essential for providing detailed maps of elemental composition on the micro- and nanoscale. This information is valuable for identifying the sources of trace impurities in pharmaceutical compounds that could be introduced during manufacturing processes.
Controlled-Release Formulation
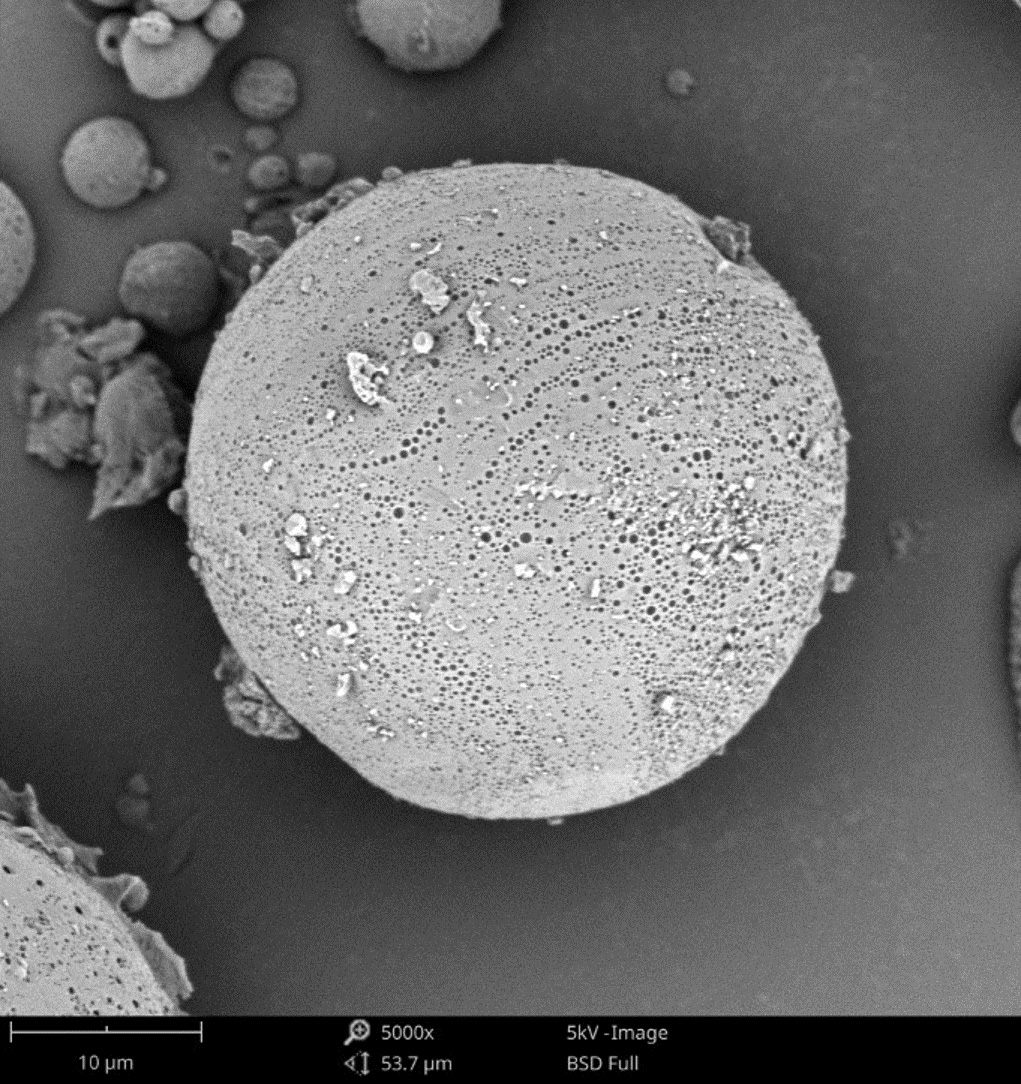
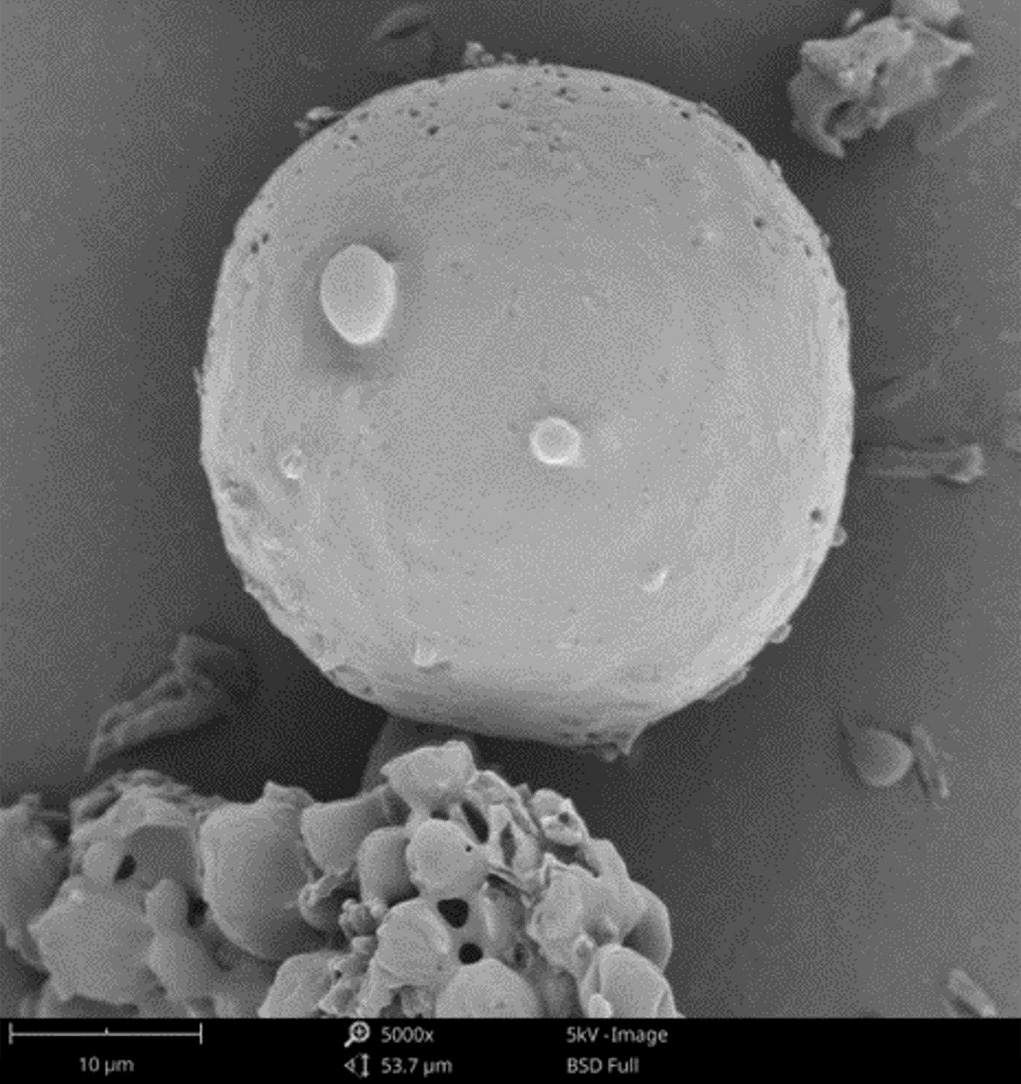
Controlled-release delivery systems are designed to release encapsulated pharmaceutical ingredients over longer periods by gradual diffusion out of a material matrix. The release profiles are controlled by the matrix structure and properties. Polymer matrices are commonly used, where the active drug diffuses through pores and channels within the polymer network. For visualizing these networks, SEM is uniquely suited to directly imaging pore structures in high resolution. As an example, SEM can be applied to cross-sectional polymer matrices at incremental time points during release testing. Using Phenom’s PoroMetric image analysis software, pore size distributions can be measured to allow for changes over time to be readily identified. The knowledge gained from direct visualization can be leveraged to optimize pore dimensions or assess the overall uniformity of these microstructures. Furthermore, due to the high level of resolution, morphological evolution can show exactly how pore architecture transforms during API cargo release. Figure 3 shows a comparison between a porous microsphere and a smooth microsphere, each being affected by their respective surfaces as they pertain to drug release.
Stability Testing
Drug formulations need to be stable enough to withstand the temperature and humidity fluctuations encountered during manufacturing, transport, and storage. However, both physical and chemical breakdown of originally optimized compositions can be challenging obstacles. Undesired effects like aggregation, cracking, and precipitation occur due to active and inactive ingredient interactions and environmental exposures. SEM is used to evaluate formulation morphology and composition changes over time to establish a stronger understanding of overall stability. With high-resolution visualization, nanoscale physiochemical changes are easily identified and evaluated with SEM/EDS.
Drug Delivery Devices
A drug delivery device is a specialized tool or apparatus designed to administer therapeutic substances, such as medications or drugs, to a patient. These devices are crucial in ensuring that drugs are delivered in a controlled and effective manner, often targeting specific areas of the body, or providing sustained release over time.
Microneedles are one example of the emerging transdermal drug delivery method designed to painlessly penetrate the skin’s barrier layer and deliver drugs to targeted areas under the skin. They are manufactured structures composed of microscale needles arranged on a patch that is applied to the skin. When applied, the microneedles create small temporary pathways into the epidermis and upper dermis layers for therapeutic agents to follow and ultimately begin systemic circulation. Due to the size domain of this technology, SEM is valuable for ensuring the quality of fabricated microneedles such as solid, dissolving, hydrogel, coated, and hollow types. With high-magnification imaging clearly showing needle integrity, shape uniformity, coatings, and more, SEM imaging helps pharmaceutical researchers advance novel delivery platforms into clinical applications.
Key Takeaways
In the pharmaceutical industry, the combination of SEM and EDS is invaluable for its utility and versatility. These two techniques provide critical insights into particle characterization, impacting drug efficacy and overall bioavailability. The ability of SEM/EDS to detect trace impurities is vital for ensuring product purity, which in turn saves significant costs if batches are soiled, and safety to those who receive the end product. Additionally, in controlled-release formulation and stability testing, SEM/EDS’s precise analysis is key to optimizing shelf life and release mechanisms upon administration. Lastly, though this is not an exhaustive list of all applications, SEM and EDS are used to ensure the structural and functional integrity of drug delivery devices, proving that they are not just methods by which pharmaceutical researchers conduct their science, but essential elements in upholding the industry’s quality in healthcare solutions.