Introduction
When using contact angle measurements to analyze the wettability of a surface, certain assumptions are made about the sample: the surface is unreactive, rigid, insoluble, chemically homogenous, and smooth. While reasonable inferences can be made about a surface’s physical and chemical characteristics, some roughness will always be present. As we move away from ideal-smooth surfaces to real-world samples, the topography of a sample surface can significantly alter the measured contact angle, affecting how liquids adhere. And depending on the surface’s function, this may be helpful or detrimental to its bottom line. Therefore, accounting for surface roughness during optical tensiometry measurements is critical to differentiate the effects of surface chemistry and physical topography. This is relevant to numerous fields where wettability and adhesion are fundamental for operation, such as medical device biocompatibility, printing on paper, structural integrity in additive manufacturing, and surfaces after abrasive processing. In this tech note, we will discuss specific examples of how surface roughness influences contact angle measurements and their impact of different applications.
Integrating Contact Angle Roughness Correction: Attension 3D-Topography Module
Applications: Paper, Printing & Packaging
In printing and packaging materials, the adhesion and finishes of inks, glues, and surface coatings are strongly influenced by their wetting properties. Optimizing these properties can play a crucial role in maintaining high quality prints of finished products. Due to the fiber structure in many paper and cardboard products, many of these materials have micron-scale roughness. This roughness can in turn directly influence the wetting properties of coatings and inks. Irrespective of the use, separating the effects of roughness and surface chemistry can help with developing ink formulation, managing new paper/packaging materials, optimization of surface coatings, or controlling overall quality of the paper materials.
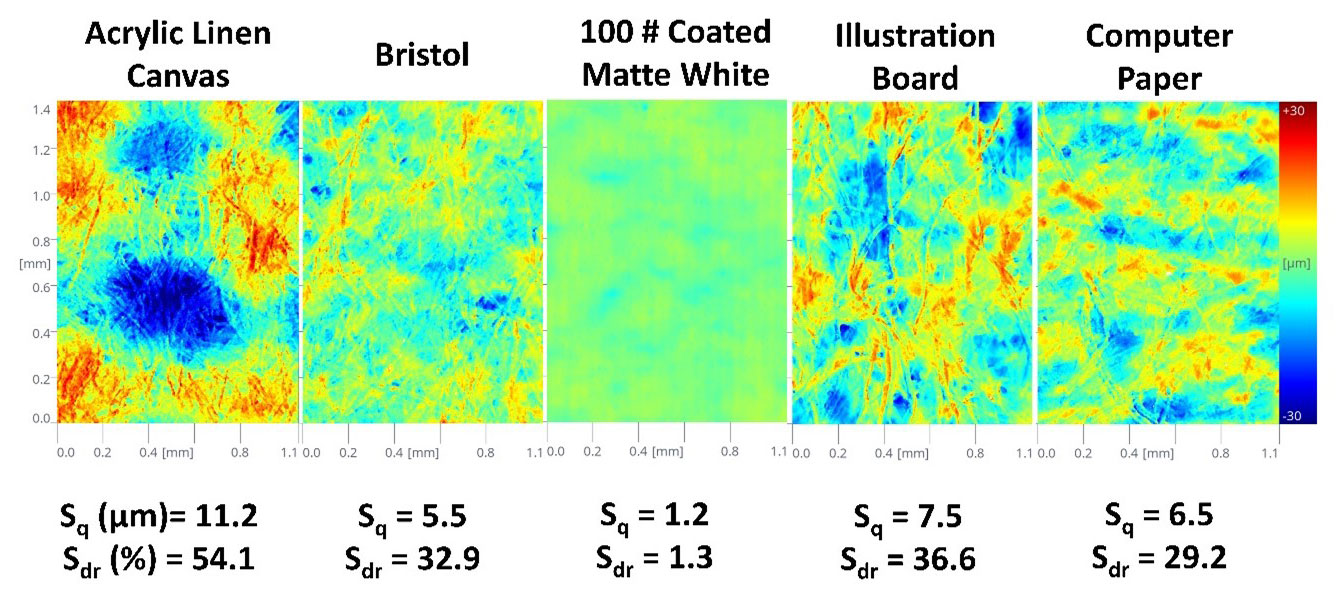
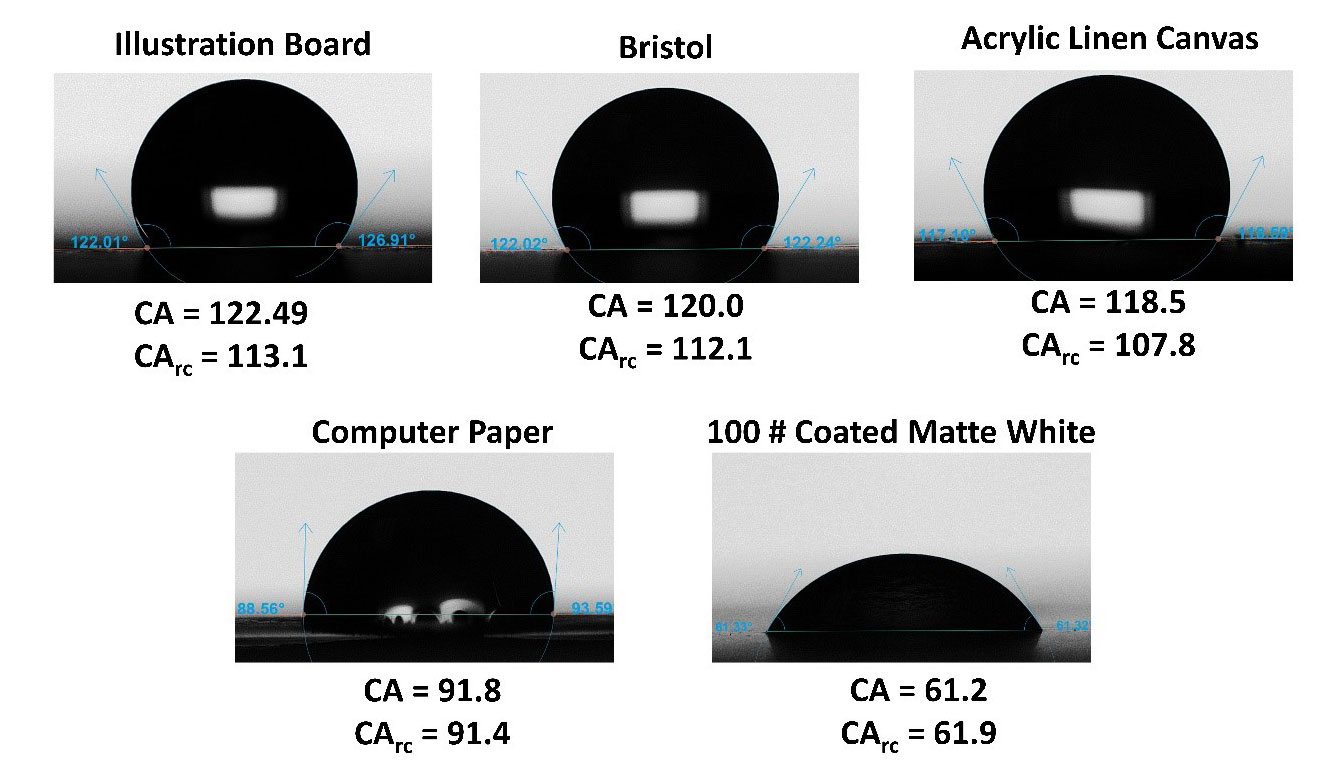
To demonstrate this, roughness corrected contact angle measurements were carried out on five different paper products with varying base materials and roughness. This was done with two probe liquids: water for measuring the general wettability and an acrylic based ink that might be used to coat these materials. Shown in Figure 2 is the 2D topography image with the corresponding RMS roughness and the projected area ratio. From the measurements, roughness follows the increasing order of ‘100 # coated matte white’ < ‘computer paper’ < ‘bristol’ < ‘illustration board’ < ‘acrylic linen canvas’. The ‘100 #’ was found to be the smoothest by an order of magnitude, which can be attributed to its lack of fibers structure with respect to the other papers. When combining the roughness data with the contact angle measurements, shown in Figure 3, it was found that the rougher paper samples (illustration board, Bristol, and acrylic linen canvas) were relatively hydrophobic, with the roughness increasing the apparent contact angle by up to 9°. The main exceptions were with ‘computer paper’ and ‘100 #’: with a contact angle close to 90°, any roughness effects of the computer paper surface will minimally alter the contact angle, as the Wenzel model corrects towards 90°. With ‘100 #’, its overall smoothness results in minimal deviation of the contact angle from its topography, as the measured angle will be equal to the equilibrium contact angle on smooth surfaces when r = 1 in the Wenzel equation.
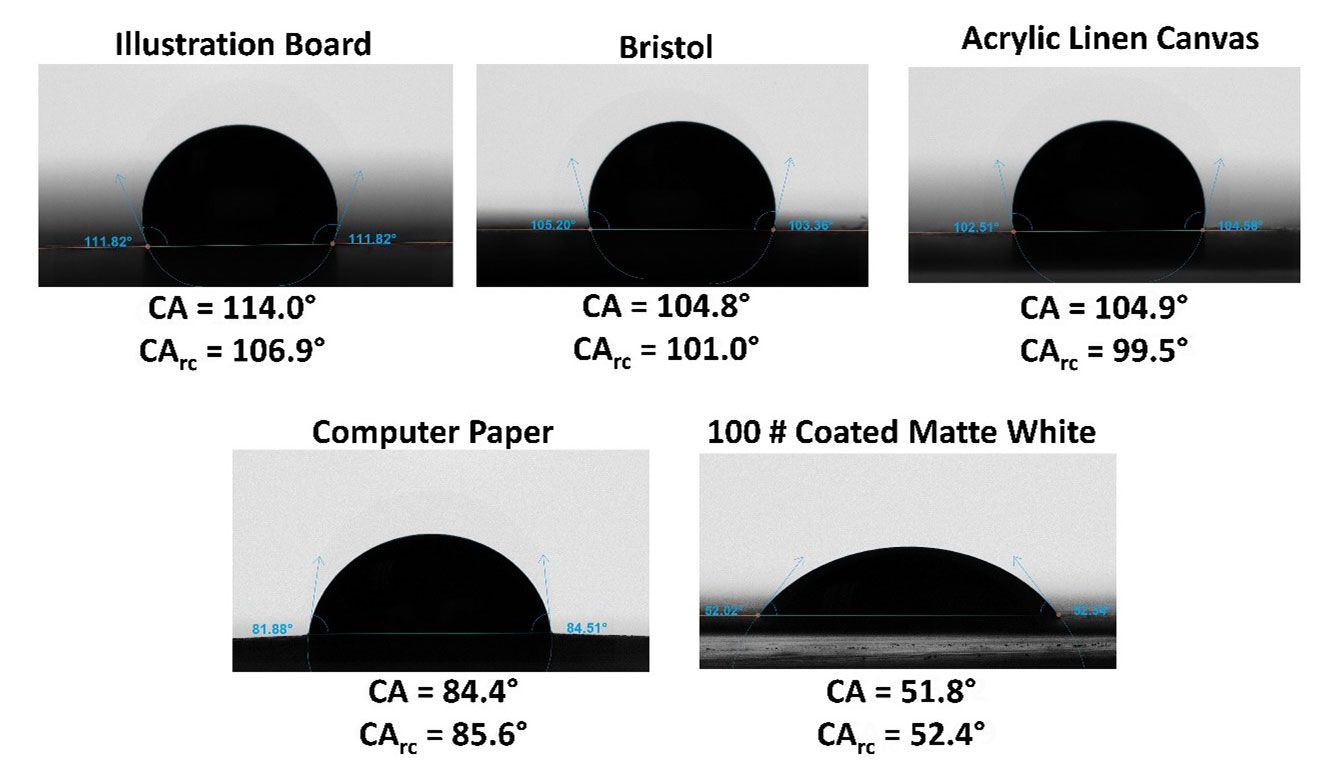
Moving from water to acrylic ink, it’s observed that the contact angles are generally lower across the board but follow a similar trend in wettability (Figure 4). As the contact angles of the rough samples (illustration board, Bristol, and acrylic linen canvas) are lower, the correction to the contact angle is smaller than with water. As wetting is a prerequisite and deciding factor for adhesion, the ‘100 #’ sample will have the strongest ink adhesion, with the illustration board likely having the smallest ink adhesion.
Applications: 3-D Printing/Additive Manufacturing
In the advent of inexpensive and user-friendly 3-D printing devices, the pace of rapid prototyping has increased and become increasingly accessible to engineers, scientists, designers, and hobbyists alike. While the additive manufacturing process can vary greatly with the 3-D printing technique, wetting properties and by proxy the surface topography can influence multiple stages of a printed sample. For example, in selective laser sintering (SLS), where a metal-based powder bed is selectively melted with a high-energy laser, wetting properties of the melted layer are critical for adhesion and limiting defects.1-3 After a device is printed, it may be necessary to adhere multiple parts together as part of an assembly. With wettability being a fundamental aspect of glue or resin adhesion,4 the chemistry and surface structure are critical factors for effective part bonding. Beyond the structural integrity of a 3-D printed part or assembly, surface wetting can be essential to devices’ use. This is particularly important for 3D printed microfluidics and medical devices, where the printing conditions can alter the surface structure and therefore the wetting functionality.5
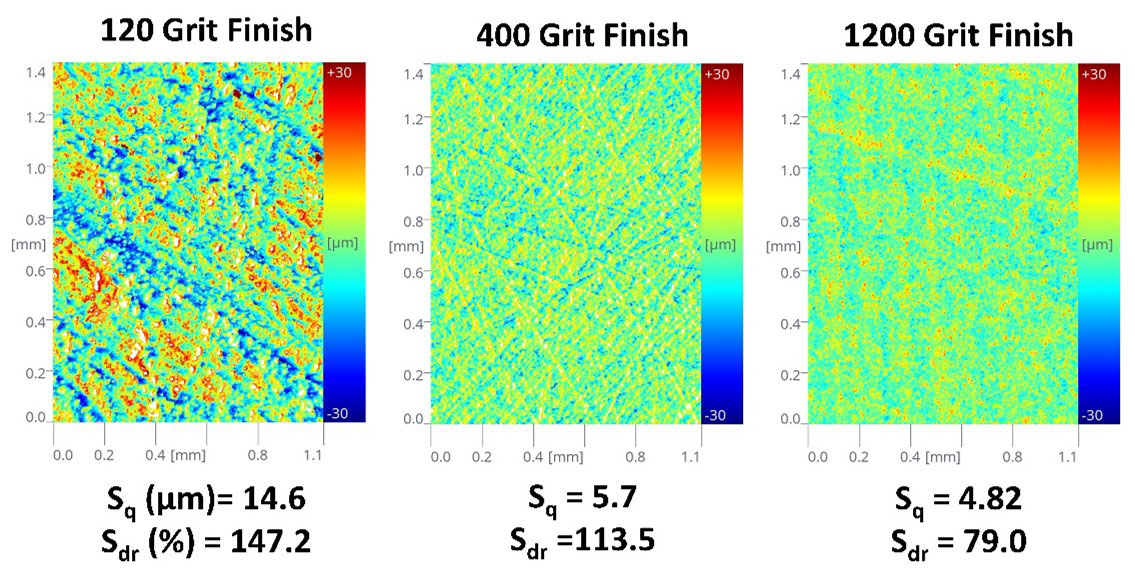
To probe the effects of surface finishes in additive manufacturing, a flat object was printed in grey resin with stereolithography (Formlabs Form 3) at the maximum resolution (0.025 mm). Following printing, the part was washed with IPA, and then sanded with different grit silicon carbide sandpaper: 120, 400, and 1200 grit. Following the sanding, the part was rinsed with water and dried before analysis with roughness corrected contact measurements. Shown in Figure 5 is the 2D topographical images, with a clear increase in roughness going from the 1200 to 120 grit finishes, as represented by both the Sq and Sdr values. Like most polymer surfaces, the water contact angle measurements demonstrated that the 3-D printed part was hydrophobic, as shown in Figure 6. In line with the Wenzel model, the contact angle increased systematically with the roughness, with apparent contact angles measured from 106.3° to 119.2° to 131.1° as the grit finish decreased. By applying the roughness correction with the Wenzel model, the equilibrium contact was found to be closer to ≈100° for all surfaces, validating the application of this model.

While roughening the already hydrophobic surface increased its hydrophobicity, the change in wettability depends on the intermolecular properties of liquid. In many cases, resins and glues will have a lower surface tension and increased wetting on polymer surfaces. If the liquid has favorable wetting, then we should expect to see that roughness will decrease the contact angle, giving increased adhesion. Further, roughening the surface will increase the surface area allowing a larger adhesive contact. These combined effects have resulted in stronger adhesion with 3-D printed parts.6 To study this, contact angle measurements on the 3-D printed parts with different surface finishes were carried out with an epoxy resin. For these measurements, the hardener was omitted to prevent setting mid-measurement. Figure 7 shows the resulting resin contact angles, where now the 120 grit sanded surface has the lowest contact angle (12.2°), followed by the 400 grit (13.6°), with the 1200 grit maintaining the highest contact angle (19.9°). The roughness correct contact angle shows the equilibrium resin contact angle at ≈60°. Compared to the water contact angle results, the 120-grit finished surface contact angle was corrected past the 1200 grit finish contact angle by almost 10°. It may be that the Wenzel model here is somewhat overcorrecting the equilibrium contact angle, and its use is less valid in this surface/liquid combination. Regardless, the 120-grit sanded surface will likely have the best bonding and adhesion with this epoxy resin as evidenced by the lowest measured contact angle.

Conclusion
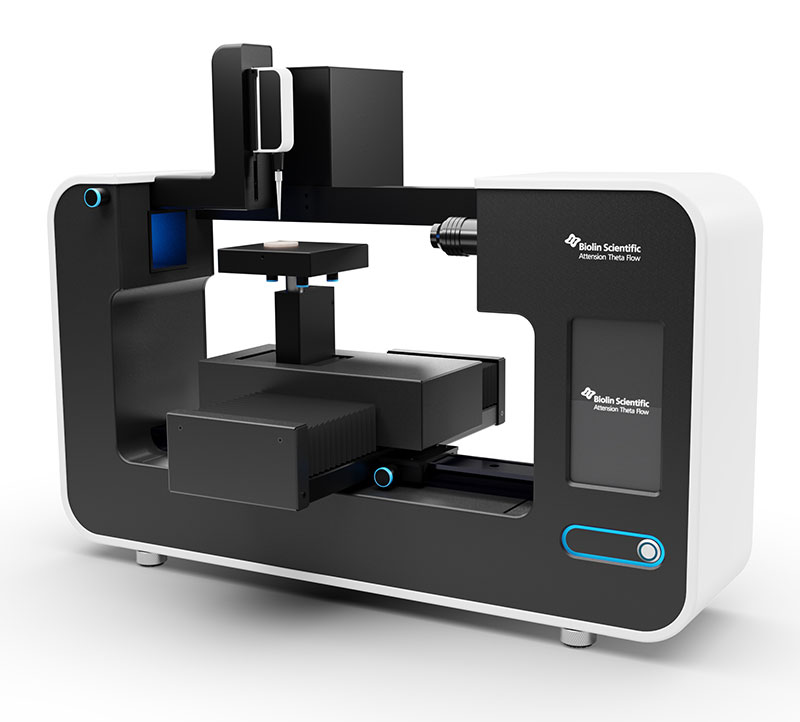
In this application note, we demonstrated that the Theta Flex and Flow optical tensiometers equipped with 3D-Topography module can be effectively used to separate surface chemistry from roughness in contact angle measurements of wettability. This was accomplished in industry relevant examples of paper, printing, and packaging, and in the surface finishes of 3-D printed parts. Beyond these applications, this technique is relevant to virtually any coating process on a surface with micron scale roughness where high-quality adhesion is desired. While there are some limitations, the fully automated Theta 3D-Topography system can provide the most accurate application of the Wenzel model to correct wettability measurements for surface roughness at the exact location of the droplet.
References
[1] Zhou X., Liu X., Zhang D., Shen Z., Liu W., “Balling phenomena in selective laser melted tungsten”, Journal of Materials Processing Technology, vol. 222, 2015
[2] Li J., Li J.-Q., Fan T.-H., “Phase-field modeling of wetting and balling dynamics in powder bed fusion process”, Physics of Fluids, vol. 33, 2023
[3] Korneev B., Zakirov A., Bogdanova M., Belousov S., Perepelkina A., Iskandarova I., Potapkin B., “A numerical study of powder wetting influence on the morphology of laser powder bed fusion manufactured thin walls”, Additive Manufacturing, vol. 74, 2023
[4] Wang Y., Hansen C. J., McAninch I. M., Robinette E. J., Peterson A. M., “Resin Wettability Correlates Linearly to Interfacial Fracture Energy between Thermosetting Elastomers and Glass”, ACS Applied Polymer Materials, vo. 4, pp. 4244-4253, 2022
[5] Kang J-.W., Jeon J., Lee J.-Y., Jeon J.-H., Hong J., “Surface-Wetting Characteristics of DLP-Based 3D Printing Outcomes under Various Printing Conditions for Microfluidic Device Fabrication”, Micromachines, vol. 15, pp. 61, 2024
[6] Kariž M., Tomec D. K., Dahle S., Kuzman M. K., Šernek M., Žigon J. “Effect of Sanding and Plasma Treatment of 3D-Printed Parts on Bonding to Wood with PVAc Adhesive.” Polymers (Basel), vol. 13, pp. 1211, 2021

