In science and engineering, analyzing microscopic particles is crucial for applications like quality control in manufacturing and nanotechnology research. Accurate particle characterization is vital for understanding bulk powder properties, detecting contaminants as well as their root causes, and verifying composition. Bulk techniques are useful for analyzing homogeneous materials or large-scale elemental distribution but lack precision when analyzing samples with mixed phases or complex compositions at the microscale.
Energy dispersive spectroscopy (EDS) is a microanalysis technique that provides localized elemental composition data, typically used in conjunction with scanning electron microscopy (SEM). While SEM-EDS can provide elemental composition at the level of individual particles, it involves a time-consuming multi-step process.1 ChemiSEM is an advanced technology that combines SEM and EDS to deliver ultra-fast and dynamically integrated results. In this blog, we will explore the technical advantages of SEM-EDS in microscopic particle analysis and examine how ChemiSEM enhances efficiency and accelerates data-driven decision-making through real-time elemental mapping.

Particle Analysis using SEM-EDS
SEM-EDS is crucial in particle analysis because it combines high-resolution imaging with localized elemental composition data, allowing for comprehensive characterization of particles’ structure and chemistry. This dual capability helps identify particle morphology, detect contaminants, and understand material properties at the nanoscale. Additionally, SEM-EDS provides rapid, non-destructive analysis, making it a powerful tool for quality control, research, and materials development across various industries.
Analyzing the composition of particles through SEM-EDS allows researchers and engineers to accomplish these goals:
- Identification of Material Composition: SEM-EDS allows for precise determination of the elemental makeup of individual particles, helping identify their composition.
- Detection of Contaminants or Impurities: By mapping elemental distribution, SEM-EDS can reveal the presence of contaminants, inclusions, or unwanted materials within a sample.
- Analysis of Particle Morphology and Structure: SEM imaging provides detailed visualization of particle size, shape, and surface features, which, combined with EDS data, enables a comprehensive understanding of structure-property-processing relationships.
What is ChemiSEM?
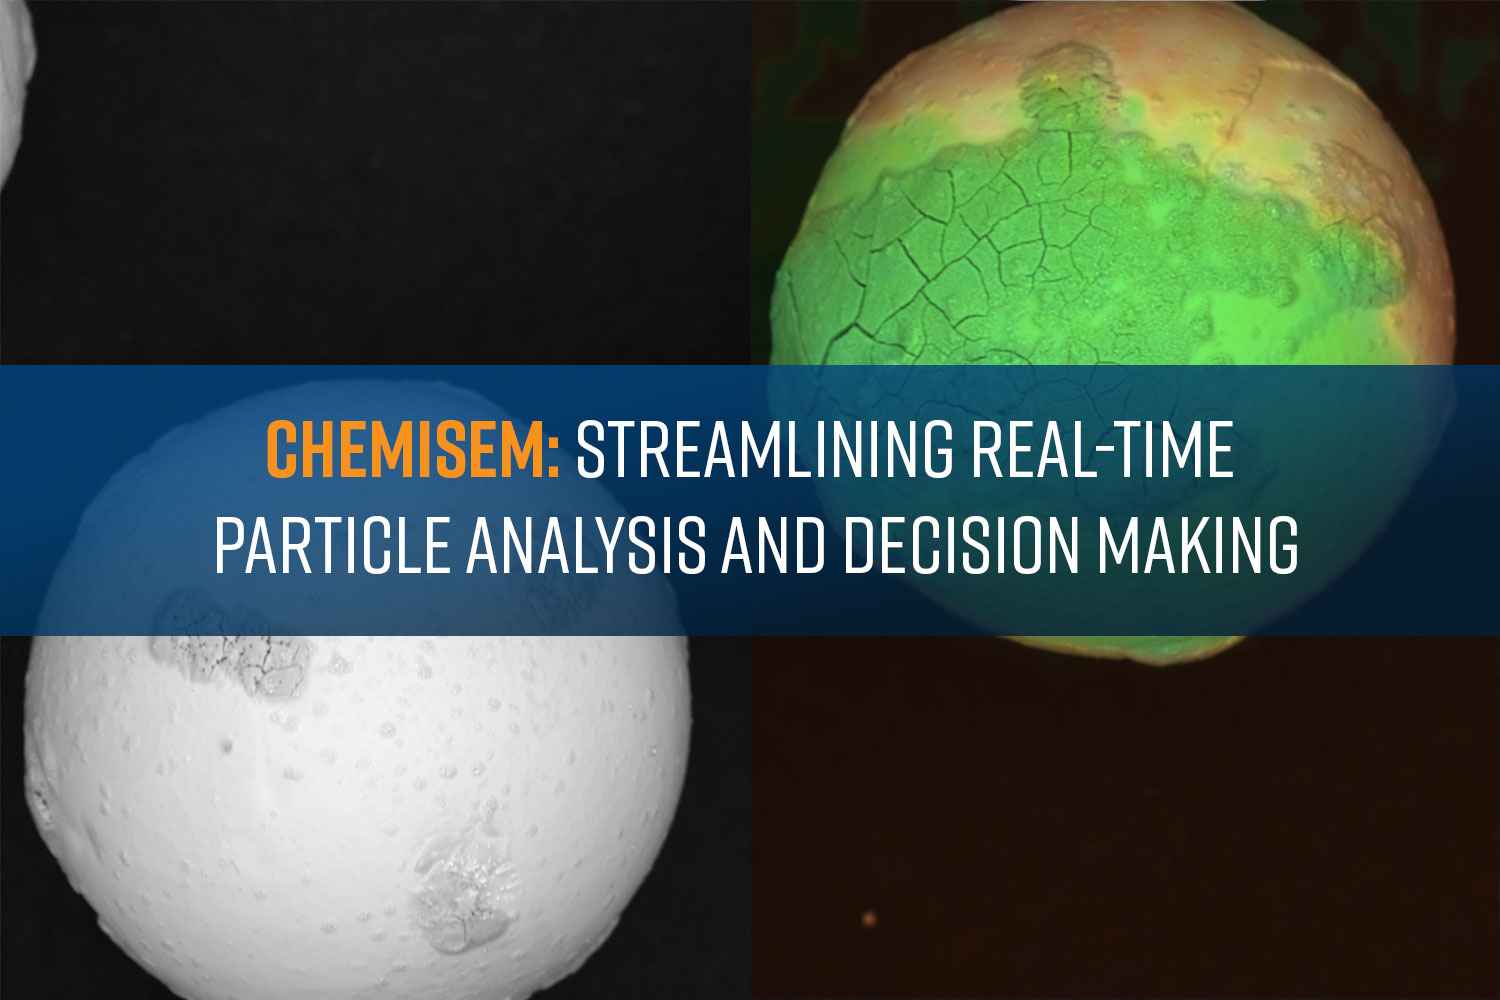
ChemiSEM is a new software feature available in the Phenom User Interface, available to all compatible Phenom Desktop SEM systems equipped with EDS detectors. By combining SEM and EDS into an integrated display mode, ChemiSEM generates real-time color-coded elemental maps directly over the SEM live image.2 Compared to conventional SEM images, ChemiSEM images provide a more comprehensive visualization of sample morphology and elemental distribution (Figure 1).

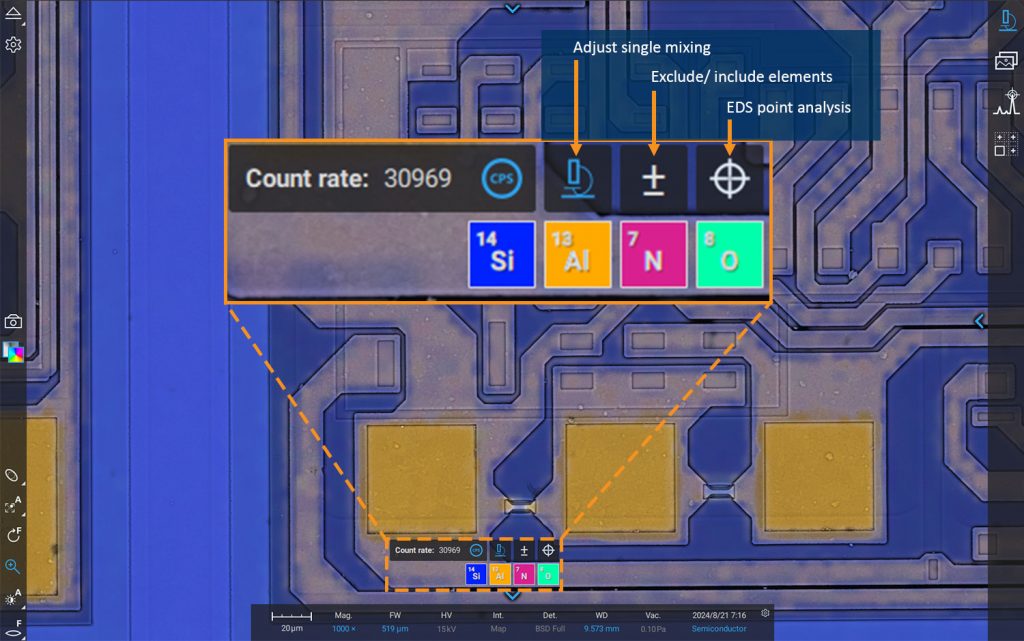
The ChemiSEM user interface is designed with an intuitive layout so it can be easily utilized during live imaging (Figure 2). The control panel at the bottom of live view mode displays a real-time readout of x-ray count rate (in counts per second) as well as all automatically identified elements as color-coded icons that correspond to the ChemiSEM image shading. The microscope icon allows for the intensity of the color overlay to be adjusted relative to the SEM image. It can be adjusted so that only the SEM image is visible or only the ChemiSEM color image is present on the live view. Clicking the plus/minus icon displays a periodic table where elements can be included or excluded from the ChemiSEM image. The crosshair icon facilitates point analysis, wherein the cursor can be placed at any location in the live image and the elemental abundance data (in weight %) will be automatically displayed in a pop-up window.
Real-Time Elemental Analysis of Particles Using ChemiSEM
A typical particle analysis workflow often starts with collecting several high-resolution SEM images to capture a statistically significant number of particles. If an abnormal particle is detected, the user may go back to analyze that area for elemental composition using EDS, especially to check for contaminants. However, this step-by-step approach slows down data collection, makes it harder to quickly link particle shape with its composition, and increases the chance of errors, reducing efficiency for making fast decisions.
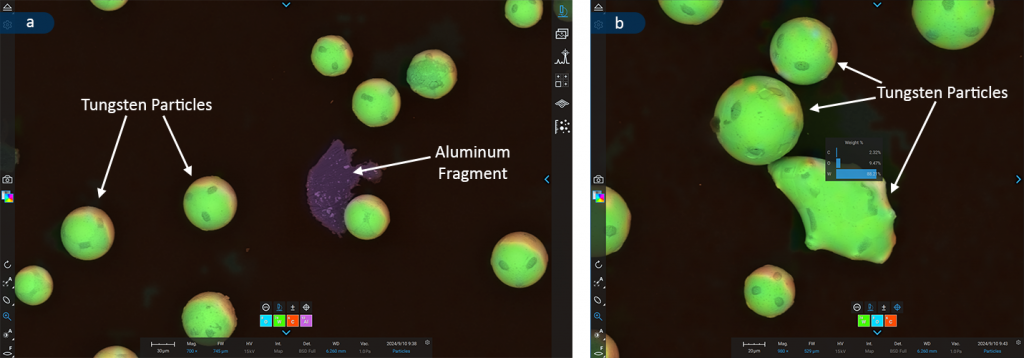
This example demonstrates how ChemiSEM effectively addresses common bottlenecks by enabling instant classification of abnormal particles. A sample of ~50-µm tungsten particles was analyzed using a Phenom ProX Desktop SEM with ChemiSEM at 15 kV. As shown in Figure 3, the elemental composition of two irregularly shaped particles could be instantly visualized. The first particle (Figure 3a) is predominantly aluminum, indicating contamination either originating from the sample or the SEM stub. In contrast, the second particle (Figure 3b) has a composition matching the tungsten particles, suggesting it formed under different conditions, leading to its irregular shape.
Key Takeaways
Elemental analysis is a critical aspect of particle analysis that provides deep insights into the material composition and characteristics of particles. ChemiSEM’s integration of SEM imaging with instantaneous elemental analysis streamlines the data collection process, saving time and allowing for on-the-fly decision making. The example above demonstrates its key benefits, including:
- Immediately gain real-time imaging and EDS data, allowing for the instant visualization of elemental distribution within particles and making it easier to spot contamination
- By combining imaging and elemental analysis into a single easy interface, ChemiSEM streamlines the analytical process, reducing the need for multiple software tools
- Additional functions like the spot analysis tool, signal mixing adjustment, and the ability to exclude and include other elements provides added flexibility for a wide range of use-cases
Learn more about ChemiSEM here: Enhancing Elemental Analysis with Real-Time Mapping: Phase Identification Using ChemiSEM & Phase Mapping
References
- B. G. Kutchko and A. G. Kim, “Fly ash characterization by SEM–EDS,” Fuel, vol. 85, no. 17-18, pp. 2537-2544, 2006. https://doi.org/10.1016/j.fuel.2006.05.016 ↩︎
- P. Wandrol, T. Tuma, J. Klusacek, J. Petrek, E. J. Vesseur and C. Stephens, “ChemiSEM: multimodal approach for faster quantitative elemental mapping.,” Microscopy and Microanalysis, vol. 27, no. Suppl 1, pp. 1302-1303, 2021. https://doi.org/10.1017/S1431927621004864 ↩︎

