Introduction
Meticulous collection, analysis, and interpretation of material, including gunshot residue, obtained from crime scenes are imperative in ensuring accurate evidence is presented during legal proceedings. Forensic scientists investigate a diverse range of samples depending on the type of crime scene. From extracting trace DNA to deciphering blood spatter patterns and elucidating ballistics, their work plays a pivotal role in the pursuit of justice. Recognizing the profound impact physical analysis has on resolving crimes, it is necessary to employ analytical tools that are exceptionally accurate and reliable.
Gunshot Residue Analysis (GSR)
Gunshot residue analysis (GSR) is a specialized branch of forensic science that focuses on trace evidence left by suspected shooters. Discharged firearms release microscopic particles in a cloud of smoke which then deposit on surrounding surfaces, including the hands which pulled the trigger. GSR includes organic (from propellant and lubricants) and inorganic (from primer, case, barrel) components. The inorganic telltale signs that indicate when a firearm has been used consist of particles with lead (Pb), barium (Ba), and antimony (Sb), all of which originate primarily from the primer. Recently, lead-free primers are rising in abundance and becoming more relevant in investigations. Many components of the weapon, such as the primer ingredients, bullets, barrel, casing, and propellant (gunpowder), influence the elemental concentration of Pb, Sb, and Ba in particles. The primary explosion compound typically is lead styphnate, while the oxidation and reduction compounds are comprised of barium nitrate and antimony sulfate, respectively.
The detection of gunshot residue serves as a confirmation of firearm discharge, but its analysis extends beyond mere validation. By studying distribution patterns, forensic experts can determine the number of shots fired and the proximity between the firearm and its intended target. GSR analysis can link individuals or objects to actions involving the transfer of residue. The information derived from these tiny particles is vital in identifying potential perpetrators, reconstructing crime events, and corroborating or challenging witness testimony.
Techniques Used in GSR Analysis
Several different techniques can be used for the analysis of gunshot residues. Colorimetric tests were some of the earliest tests used for GSR analysis, but results could easily contain artifacts due to environmental contamination. In the 1960s, instrument-based methods became widely used for their ability to detect specific components of GSR. Neutron activation analysis (NAA) detects Sb and Ba but requires a relatively large sample size and a nuclear reactor. Atomic absorbance spectroscopy (AAS) detects Pb, Ba, and Sb in trace samples but is an expensive and destructive technique. Inductively coupled plasma (ICP) combined with mass spectrometry (MS) can rapidly detect various elements, but is also an expensive and destructive technique. All these techniques are slow, lack spatial specificity, and require highly trained personnel to run the instruments and interpret the results.
Scanning Electron Microscopy (SEM) stands out as the superior method for gunshot residue analysis due to its high resolution and microanalysis capabilities. With SEM, investigators can visualize and characterize gunshot residue particles at the nanoscale level, enabling precise identification of unique morphological features specific to such particles. This level of resolution ensures accurate differentiation between gunshot residue and other similar substances, reducing the risk of false positives. Moreover, SEM allows for energy-dispersive X-ray spectroscopy (EDS) analysis, facilitating elemental identification of gunshot residue components, further bolstering the credibility of the results. Finally, the non-destructive nature of the technique permits the retention of evidence, allowing for reexamination if necessary, making it a reliable and invaluable tool for forensic firearm investigations. The requirement for highly trained personnel has also been overcome with the introduction of automated SEMs.
SEM - The Standard for GSR Analysis
In forensic science, it is important to maintain accuracy and reproducibility across measurements to draw reliable conclusions. SEMs can probe the microscale structures of particles from gunshot residues with high resolution to reveal morphological details that indicate fast-cooled droplets of molten materials that are characteristic of GSR. The addition of EDS enables compositional analysis on the individual particle level, allowing for unambiguous detection of gunshot residue particles from trace samples. Being a non-destructive technique, the sample can be preserved for additional testing.
To ensure standardization across industries and governments worldwide, ASTM International releases technical standards that define testing protocols such as those used for GSR. ASTM E1588 is intended for use by laboratory personnel involved in performing GSR analysis using SEM and EDS. Per ASTM E1588, SEM in conjunction with EDS analysis must be performed through automated software control to screen the sample for candidate GSR particles. Automation ensures an accurate and repeatable workflow free from user bias and generates actionable data in the form of standardized reports. Once screening is complete, manual confirmatory analysis is necessary to verify the classification of GSR particles.
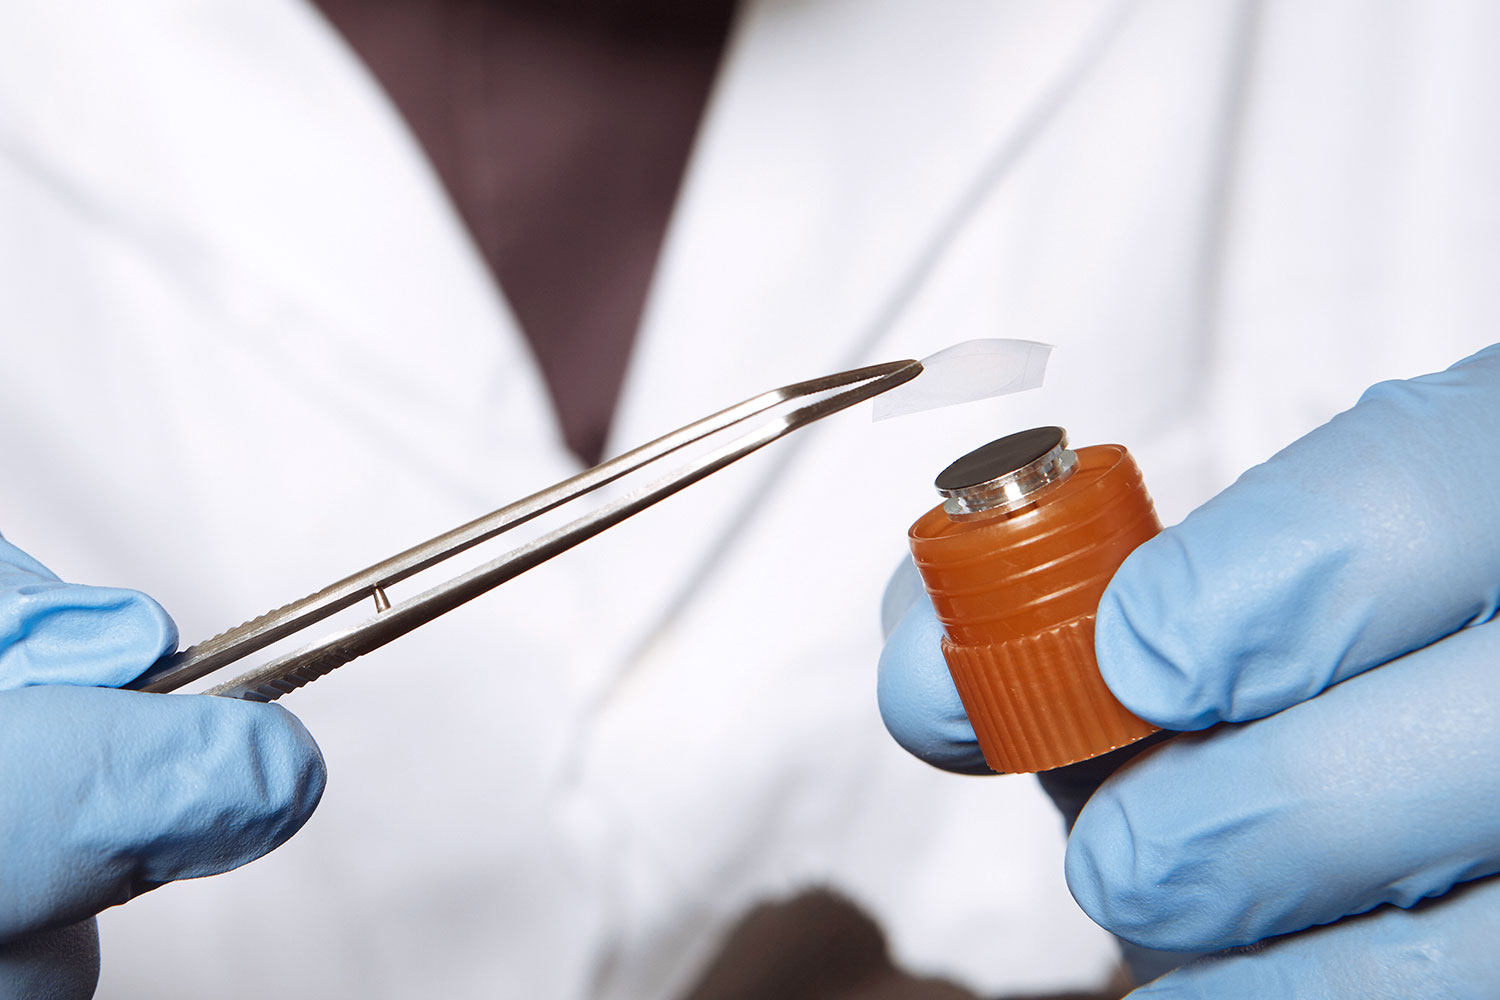
Gunshot residues can be collected from various surfaces such as parts of the human body, clothing, parts of an automobile, or the vicinity of the suspected gun discharge. The efficiency of collecting the samples will greatly affect the detection and analysis. A simple tape lift-off method is the most common method for collecting samples for SEM analysis and is used to collect GSR from various surfaces (Figure 1). An SEM aluminum stub with a carbon adhesive is used to collect the samples.
Phenom Perception GSR: A Desktop SEM for Automated GSR Analysis
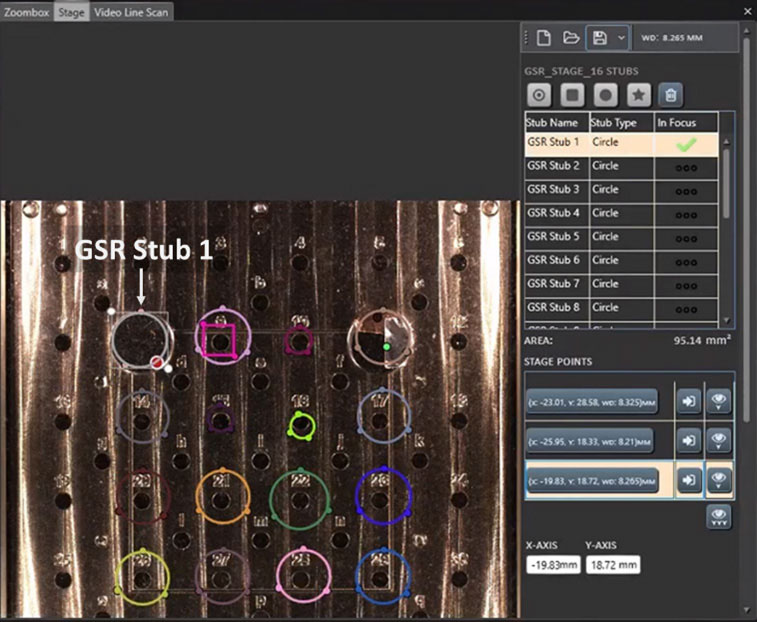
Perception GSR is an automated particle analysis software built onto the platform of the Phenom XL Desktop SEM, offering a dedicated GSR analysis solution that is compliant with ASTM E1588. The workflow of a typical GSR run involves defining a scan area for each sample stub, scanning the scan area frame by frame, using the backscattered electron detector (BSD) to detect particles, and determining the elemental composition of each particle using EDS.
The user can define the scan area by drawing a circle on each sample stub using the optical view camera (Figure 2). The X-Y coordinates and the working distance is automatically saved for each sample location. Each sample stub is automatically segmented into fields that are scanned for candidate GSR particles. Images and EDS scans of each particle are saved, and a map that indicates the location of each detected particle within the scan area is generated. Runs can be allowed to go to completion or stopped at any point to access the report section of Perception.
Perception software permits users to build and save recipes, allowing users to customize and save workflows based on their unique goals. Recipes consist of several microscope functions which can be easily dragged and dropped into the appropriate sections of the run by using the task list section. It includes adjusting the electron beam energy, spot size, and an automatic EDS calibration. For example, the Auto Video function can be used to optimize brightness and contrast at any point throughout the GSR run. The Dual Thresholding feature makes it possible to quickly scan the sample while maintaining accuracy. The first threshold loosely defines the contrast to identify a particle, and once one is found, the second detection threshold is used for acquiring higher magnification images that are used to measure the particle size.
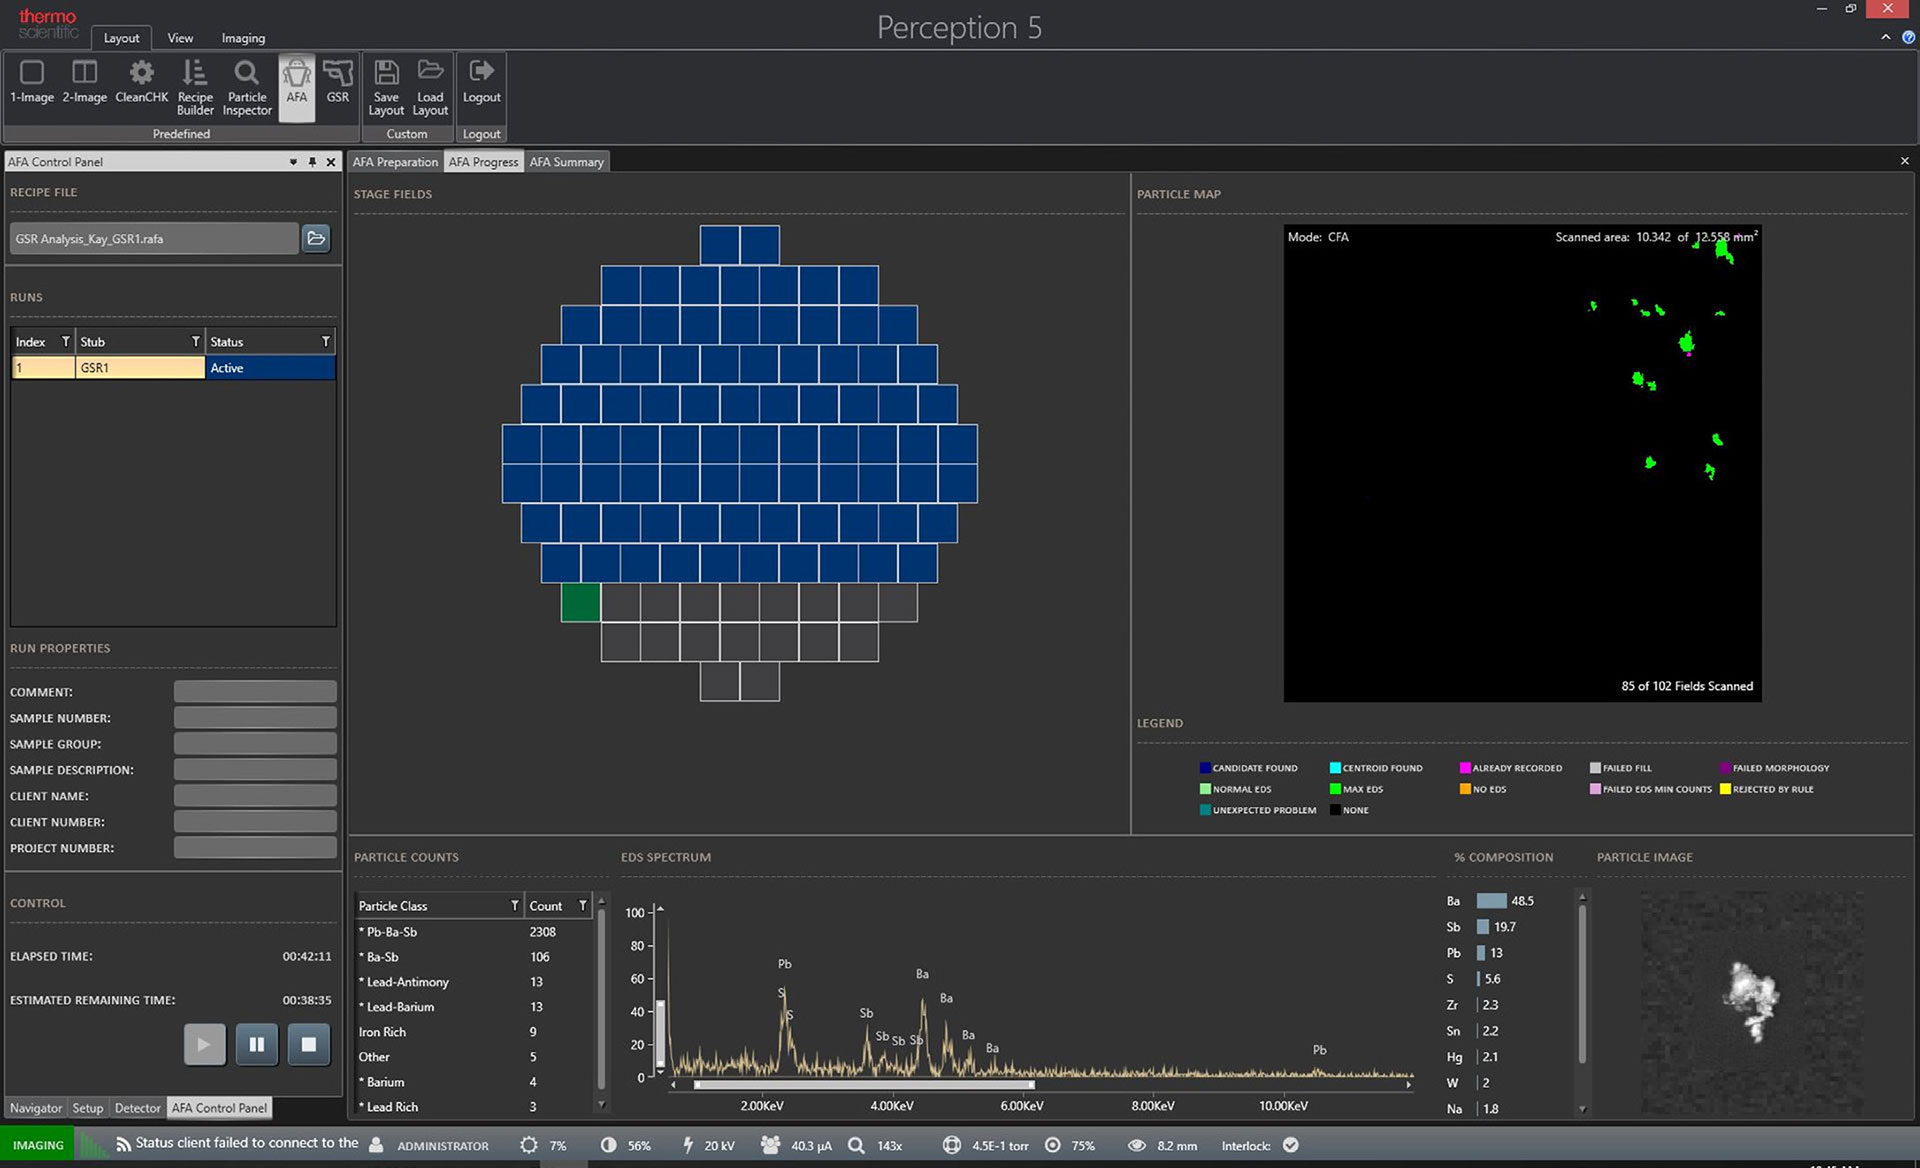
Automatic Feature Analysis (AFA) is the predominant part of Perception software where GSR runs are executed and reports are viewed (Figure 3). When a particle is detected, AFA displays both a micrograph and EDS spectrum of the particle, making it easy to quickly screen the candidate particle while also viewing additional information about the run as a whole. The GSR Reporter section of Perception allows users to locate every single particle detected during the automated scanning process for manual confirmation.
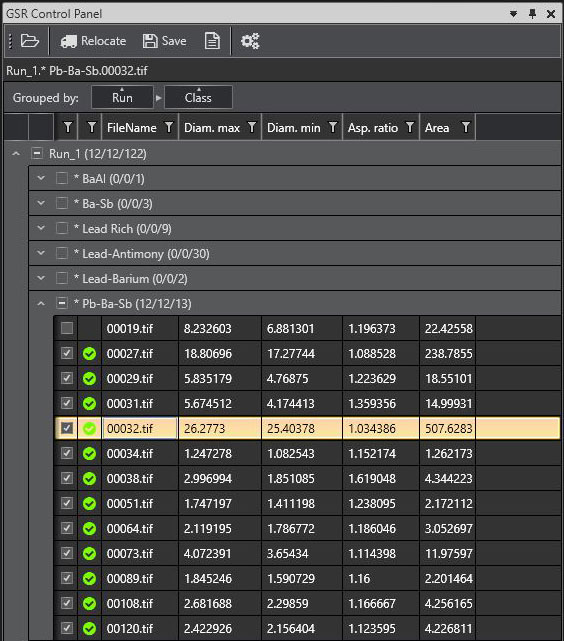
Within the control panel (Figure 4), the table groups particles by class and displays geometrical measurements for each particle. The table of particle characteristics includes the micrograph and the field number that the particle was found in. Clicking on one will relocate the electron beam to scan that field again, enabling users to perform EDS with a click and overlay a new spectrum with the spectrum obtained in the original run (Figure 5). Particles are marked as confirmed by saving the report, and a green check mark appears to indicate this fact. The report can be effortlessly formatted and customized to meet the needs of the forensic lab conducting the analysis. The users can annotate the data with comments, sample numbers, group descriptions, client names, and project numbers in open text fields.

Summary
Scanning electron microscopy (SEM) in combination with energy dispersive spectroscopy (EDS) has emerged as a powerful technique to identify gunshot residue. Phenom Perception GSR provides a comprehensive and high throughput method for conducting standard-compliant workflows involving GSR analysis and reporting. Being built on the Phenom XL Desktop SEM system, it not only provides a dedicated GSR analysis solution but also offers versability for general trace evidence analysis.

