Introduction
In the world of steel manufacturing, the quest for superior quality and performance is unending. One of the critical factors that influence the quality of steel is the presence of non-metallic inclusions. These microscopic particles, often considered impurities, can significantly affect the mechanical properties, durability, and overall performance of steel products. As the number of inclusions increases, the strength, machinability, corrosion resistance, fatigue life, and overall performance of an alloy diminish.
Minimizing inclusions requires understanding how they are formed, their elemental composition and identifying their source of origin. Scanning electron microscopy (SEM) and energy dispersive X-ray spectroscopy (EDS) are essential tools in this effort as they provide steelmakers with the means to quickly, accurately, and comprehensively pinpoint the type of an inclusion. SEM is essential for high resolution imaging to visualize these microscale inclusions, while EDS offers compositional analysis to classify them.In this article, we’ll explore how these inclusions are formed, the types of inclusions commonly found in steel, and the role of automated SEM/EDS in detecting and analyzing them.
What are Inclusions?
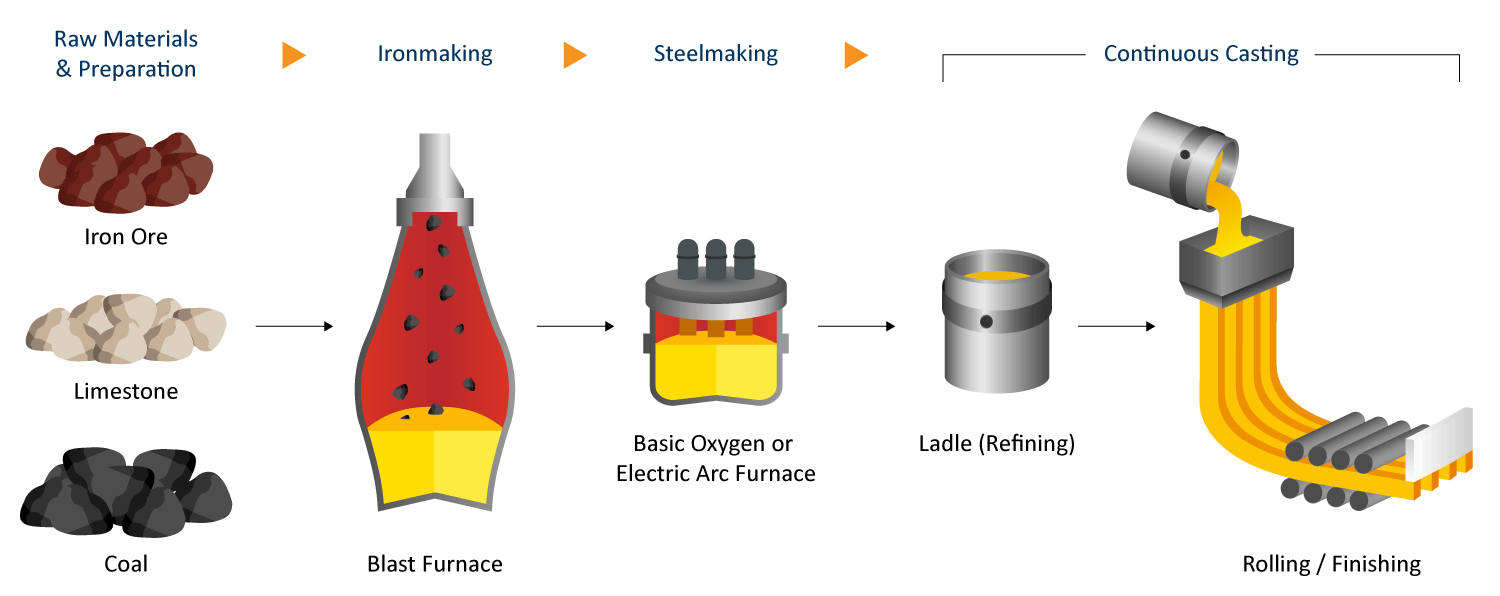
Inclusions in steel are non-metallic particles that become trapped within the metal matrix during steel manufacturing. These inclusions can arise from various sources and processes throughout the steelmaking procedure. Inclusions can come from impurities such as silicates, aluminates, and other oxides in raw materials or from the refractory linings in furnaces and ladles.
Inclusions can form during melting in the blast furnace or electric arc furnace, where initial oxidation and reduction reactions occur, forming primary inclusions. They can also form during processes like ladle refining, deoxidation, desulfurization, and alloying, forming secondary inclusions. As the molten steel solidifies, inclusions can become trapped in the solidifying matrix. which may concentrate inclusions in certain areas, leading to segregation. During pouring and casting, inclusions can also form or be introduced from the atmosphere or from contact with molds and other equipment.
There are different types of inclusions including oxides (Alumina – Al2O3, silica – SiO2, and manganese oxide MnO), sulfides (Manganese sulfide – MnS), Nitrides (Titanium nitride – TiN), carbides (Vanadium carbide – VC) and complex inclusions of oxides, sulfides, and other compounds.
Why Inclusion Assessment Matters
Additionally, a degassing step, such as using a tank degasser, may mix slag and metal. The continuous caster includes a tundish to distribute metal between strands and serves as a reservoir to hold metal between ladles. However, reoxidation always occurs at the caster tundish (due to exposure to air, refractory, ladle sand, ladle slag, and tundish slag), ultimately transforming the inclusions over time.
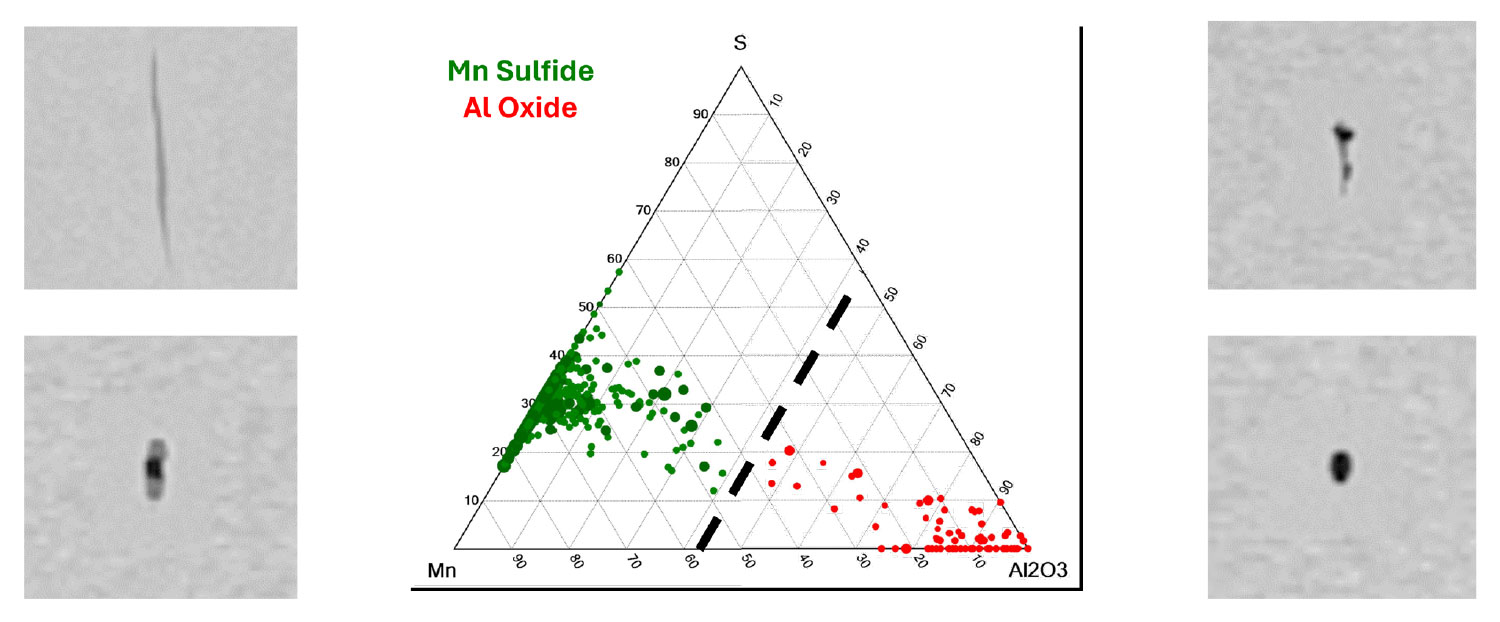
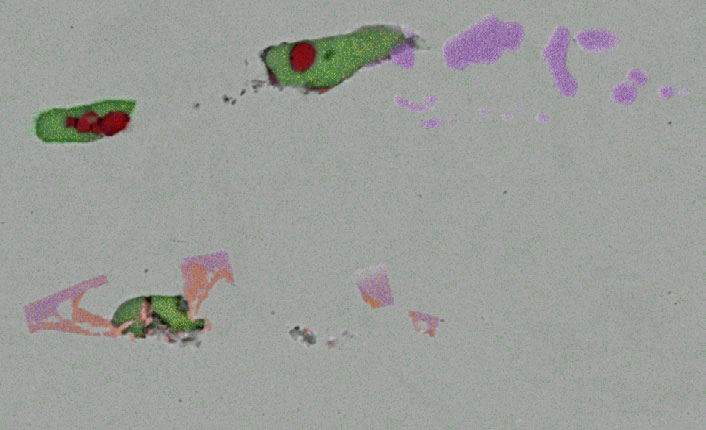
With this complexity behind inclusions in mind, understanding their types, quantities, sizes, and distributions is even more crucial for assessing and predicting steel performance and properties. Major categories of inclusions include elongated sulfide stringers, dendritic aluminate clusters, and various spherical oxides (e.g., MnO-SiO2-Al2O3). Figure 2 shows four inclusions consisting of different elements, mainly manganese sulfide and varying phases of aluminum oxide. The center of Figure 2 is a ternary diagram which visually conveys the types of inclusions in a more organized and insightful way.
ASTM Standards in Steel
Due to the random nature of non-metallic inclusions in steel, global standard bodies such as ASTM International have developed systematic methods for defining, classifying, and controlling inclusions: ASTM E45, ASTM E2142, and ASTM E2283. These standards, developed through industry consensus, provide precise methods for evaluating, rating, and reporting inclusions.
ASTM E45 is the most general of the three that categorizes inclusions based on visual attributes like size, shape, and distribution; ASTM E2142 takes this further by specifying automated SEM/EDS as a method to report inclusion chemistry alongside the morphological data of detected inclusions. ASTM E2283 is a more specific standard aimed to statistically predict the size distribution of non-metallic inclusions in large volumes of steel. By knowing the likelihood of large inclusions, ASTM E2283 gives valuable foresight in quality control.
ASTM E45
With origins dating back to the 1940s, ASTM E45 serves as the foundation for systematic inclusion assessments. Developed through broad industry cooperation, these protocols provide a standardized basis for evaluating and reporting inclusion levels in steel products.
The core of E45 involves rating methods categorizing inclusions into four types labeled as A, B, C, and D.1 Inclusions are characterized by size, shape, concentration, and distribution rather than chemical composition. Although compositions are not identified, inclusions are placed into one of several composition-related categories.
- Type A – Elongated sulfide stringers
- Type B – Discontinuous stringers of three or more oxide inclusions with particles having low length-to-width aspect ratios
- Type C – Discontinuous stringers of two or more oxide inclusions with particles having high aspect ratios
- Type D – Remaining isolated oxide inclusions
Inclusions are further grouped into thin, heavy, and oversized subsets according to width thresholds specific to the steel composition and product form.
While E45 does not require specifying inclusion chemistry, its rating system provides steelmakers with a quality benchmark and an encapsulating category system. Maximum target values for each type are often stipulated by different product specifications, regulations, or customer requirements. As such, steel plants lacking standardized inclusion assessment risk failing these acceptance criteria.
ASTM Standard E2142
Building upon the visual rating framework of ASTM E45, the E2142 standard addresses the longstanding need to incorporate composition into inclusion analysis. Published in 2008, these methods leverage SEM/EDS to systematically classify inclusions by chemistry alongside size and morphology.
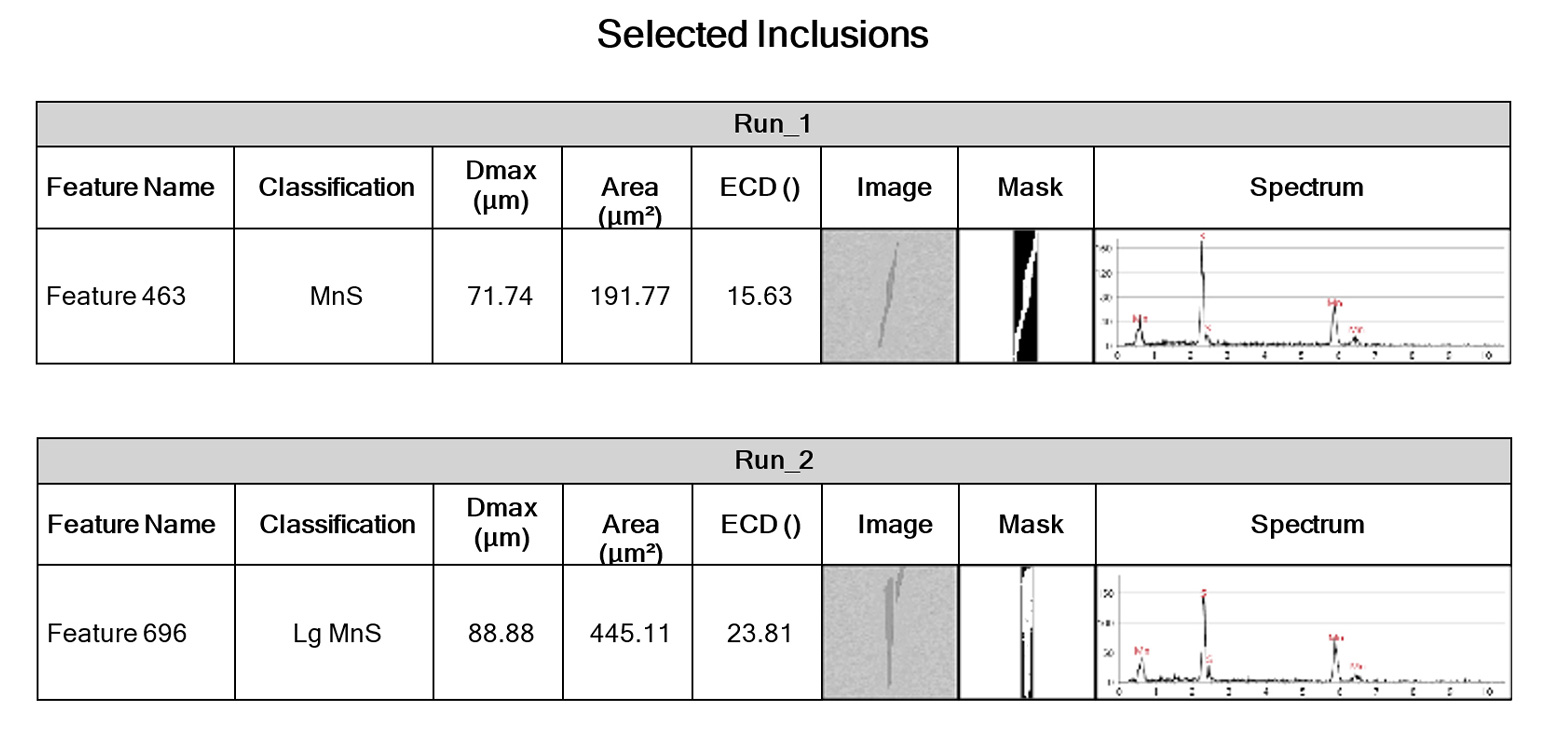
E2142 requires properly prepared samples, calibrated equipment, and defined analysis parameters to achieve repeatable results across instruments and operators. The result reveals true inclusion populations, enabling advanced insights into possible origins and consequent downstream impacts (Figure 3). Having certification with ASTM E2142 promotes consumer confidence while enabling producers to pinpoint areas in their steel in need of continuous improvement through detailed metrological data.
ASTM Standard E2283
ASTM Standards in Steel
Automated SEM such as the Phenom ParticleX Steel Desktop SEM, offers several advantages over manual SEM analysis, particularly in the context of industrial applications like monitoring steel inclusions for ASTM standards. Automated SEM can analyze a large number of samples or areas quickly, significantly reducing the time required compared to manual analysis. Automated systems can run continuously without human intervention, increasing productivity and allowing for overnight or long-duration analyses. Automated SEM follows predefined protocols precisely, ensuring consistent analysis across different samples and times, reducing variability and potential errors leading to more reliable and reproducible results. Automation also reduces the need for skilled operators for routine tasks and allows less experienced users to perform complex analyses, reducing the training burden.
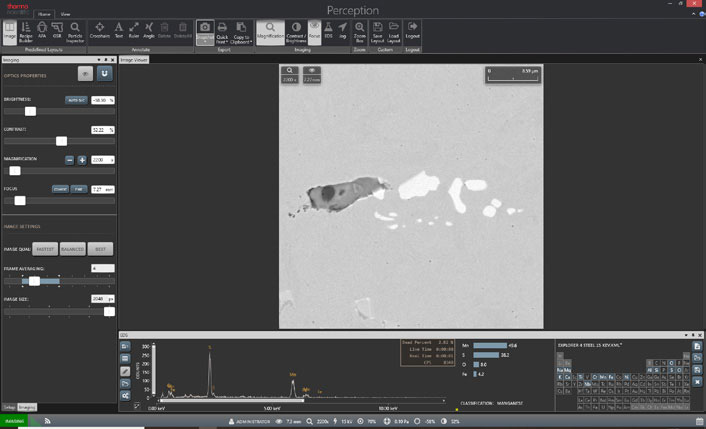
The Phenom ParticleX system offers a single solution to adhere to the three different standards: ASTM E45, E2142, and E2283. Combining SEM imaging with EDS X-ray mapping (Figure 5) the ParticleX technology precisely detects, visualizes, and categorizes hundreds of individual inclusions across large sample areas. Broad statistical scans assess overall steel cleanliness levels, while detailed metrics reveal distributions of critical inclusion types and aid in reporting.
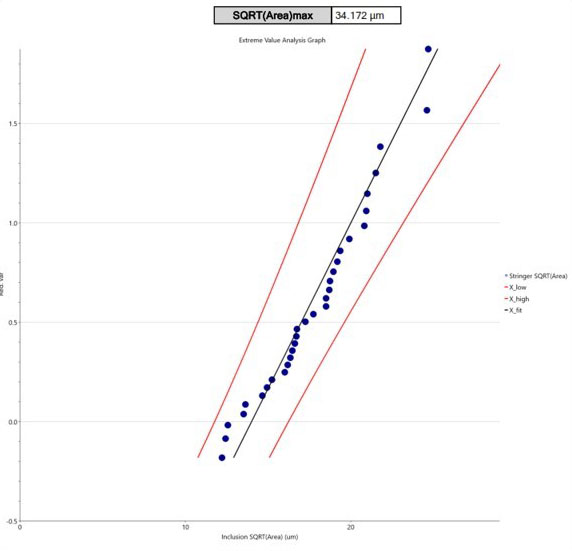
Purpose-built for high efficiency steel inclusion analysis, ParticleX Steel allows steelmakers to tap into advanced, customizable abilities (Figure 6). By generating the comprehensive data needed for both E45 determination and E2142 classification, the platform readily streamlines compliance into convenient summary documents. The addition of generating extreme value plots based on ASTM E2283 allows users to easily predict the largest inclusion in a large steel volume.
Users can tailor report templates, set classification rule parameters, dictate chemistry groupings, and adapt formats to match internal/external specifications. This flexibility, combined with automation for conducting analysis overnight, makes demonstrating regulatory compliance straightforward rather than cumbersome.
Users can tailor report templates, set classification rule parameters, dictate chemistry groupings, and adapt formats to match internal/external specifications. This flexibility, combined with automation for conducting analysis overnight, makes demonstrating regulatory compliance straightforward rather than cumbersome.
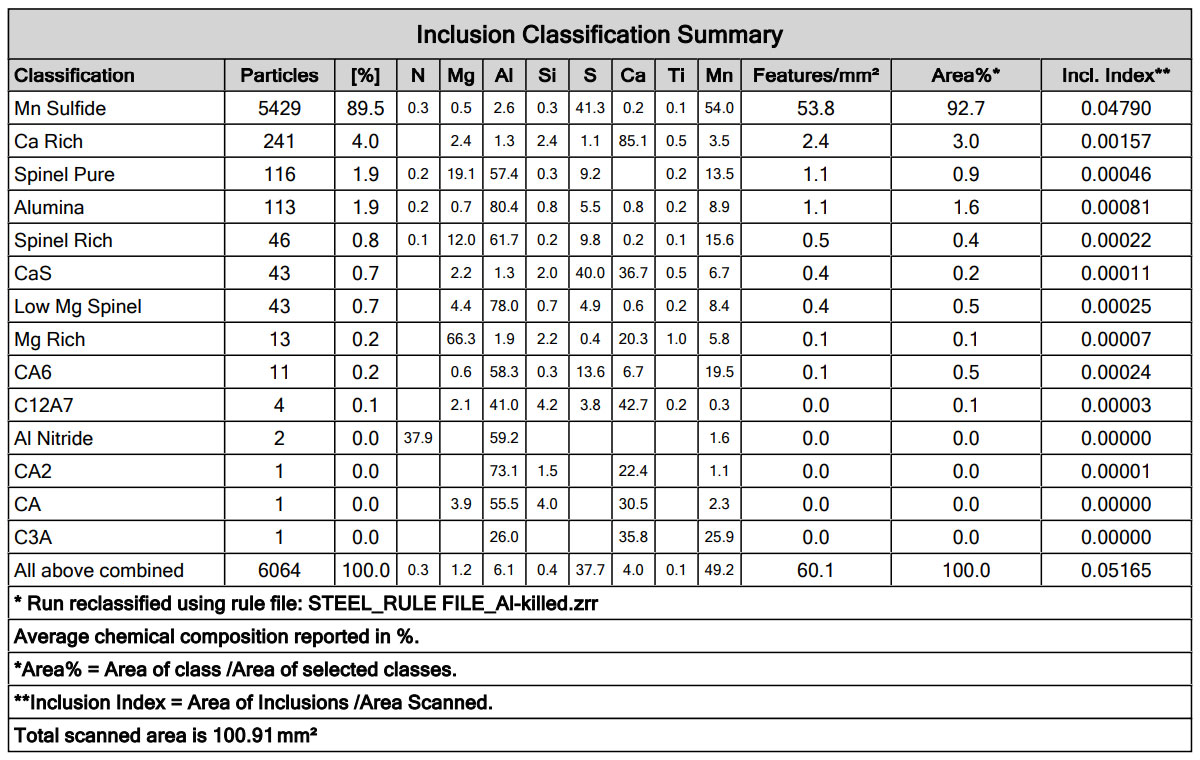
The following example covers a specific steel rule file written for Al- Killed Steel (Figure 7). The table summary conveys the results of SEM/EDS applied to a steel sample, counting the particles in addition to measuring features, classifying them, and indexing them.
Conclusion
Giant strides toward cleaner, consistent steels over the past decade now trace directly back to inclusion awareness driven by ASTM protocols E45, E2142, and E2283. However, new specifications continue raising benchmarks which prove too challenging for any manual capabilities or traditional optical microscopy methods. In extreme value analysis for large volumes of samples, this is more evident. A problem such as this requires a next-generation solution for comprehensive inclusion analysis that merges automation, adaptability, and actionable intelligence with SEM/EDS to help forge inclusion-free steels that meet the manufacturing demands of the future.
Conclusion
[1] ASTM Standard E 45, “Standard Test Methods for Determining the Inclusion Content of Steel,” Annual Book of ASTM Standards, ASTM International, 2023.
[2] ASTM Standard E 2283, “Standard Practice for Extreme Value Analysis of Nonmetallic Inclusions in Steel and Other Microstructural Features,” ASTM International, 2019.
[3] Murakami, Y., and Usuki, H., “Quantitative Evaluation of Effects of Nonmetallic Inclusionson Fatigue Strength of High Strength Steels. II: Fatigue Limit Evaluation Based on Statistics for Extreme Values of Inclusion Size,” Int. J. Fatigue 0142-1123 https://doi.org/10.1016/0142-1123(89)90055-8 Vol. 11, No. 5, 1989, pp. 296-310.