Introduction
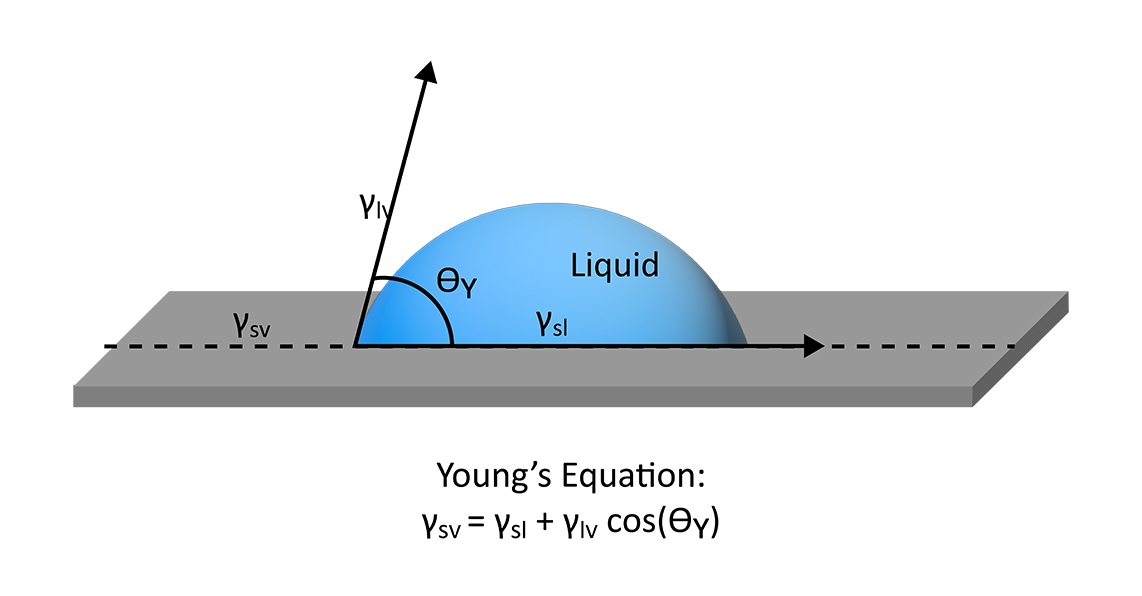
Contact angle measurements are a fundamental tool to understand the chemistry of surfaces and their wetting properties. Typically measured with side-on optical tensiometry, contact angle measurements are carried out by placing a liquid droplet on a solid surface, capturing images of the droplet on the surface, and using software to fit and measure the resulting angle at the edge of the droplet. For over 200 years, Young’s description of the contact angle, a balance of the surface and interfacial tensions at the solid, liquid, and gas phase boundary, has remained pertinent.
Young’s equation states that the contact angle of a liquid droplet on a solid surface is a function of the surface free energy of the solid (γsv), the surface tension of the liquid (γlv), and the interfacial tension between the solid and the liquid (γsl) (Figure 1). Using this equation, many useful properties can be extrapolated, like the work of adhesion, spreading coefficient, and various surface free energy models. However, Young’s description of wetting relies on a few basic assumptions for a solid’s surface that may not always be valid: the surface should be unreactive, insoluble, rigid, chemically homogenous, and smooth.
While the state of some of these properties can be reasonably inferred, all surfaces will have some roughness present. With real-world samples, any coating technologies, surface modifications, and manufacturing processes can alter both the surface chemistry and roughness. The change in surface roughness may be a byproduct of these processes or intentionally implemented, but depending on the surface’s function, this may be helpful or detrimental to its underlying application. Therefore, it is critical to assess how a sample’s surface roughness can alter the wettability and contact angle, and how the effects of surface roughness can be accounted for to separate the effects of surface chemistry and physical topography.
Impact of Surface Roughness on Contact Angle Measurements
The impact of a sample’s surface topography on contact angle and wettability depends on the state of wetting that is occurring. Typically, the type of wetting can be separated into two regimes: Wenzel and Cassie-Baxter. In Wenzel wetting, the wetting of the liquid on the surface is complete, with the liquid penetrating fully into any features on the surface. Alternatively, if the liquid does not penetrate fully into the sample surface and there are pockets of air, this partial wetting is labelled as a Cassie-Baxter state.
When there is complete wetting of the sample surface by a liquid, one of the most applied models for this Wenzel wetting state is the eponymous Wenzel model.1 In this model, a correction factor r is used to relate the measured or observed contact angle to the true equilibrium contact angle of the smooth surface (Figure 2, A). The correction factor r is directly related to the measurable area factor, Sdr, or the ratio between the interfacial and projected surface area. The correction factor is essentially the area percentage increase from surface roughness for a given theoretically smooth section of sample. This model predicts that the presence of roughness improves wetting, or lowers the contact angle, when the equilibrium contact angle on the theoretically smooth surface is below 90°. But if the equilibrium contact angle is greater than 90°, the presence of roughness reduces the wetting and increases the contact angle. In other words, with Wenzel wetting states, the presence of roughness on a surface exaggerates the existing wetting properties of the surface.
If the wetting is not complete and there are airgaps present between the droplet and sample surface, correcting the contact angle with the Wenzel model may not be sufficient; the Cassie Baxter Model (Figure 2, B) is more relevant.2 In the Cassie-Baxter model, the measured contact angle is a function of the fraction of droplet area that is on solid sample, the equilibrium contact angle on a smooth surface, and the fraction of droplet area that is on air and its contact angle. As the contact angle on air is 180°, the final equation in Figure 2, bottom panel, results in the contact angle being related to the difference in the fractional areas. With this model, unless the surface chemistry and geometry are highly designed or sufficiently characterized with external techniques, it can be challenging to practically apply the Cassie-Baxter model. In many cases, simplified versions of the Cassie-Baxter equation have been used assuming that f1 + f2 = 1, which may be incorrect unless the surface is made up of flat pillars.³
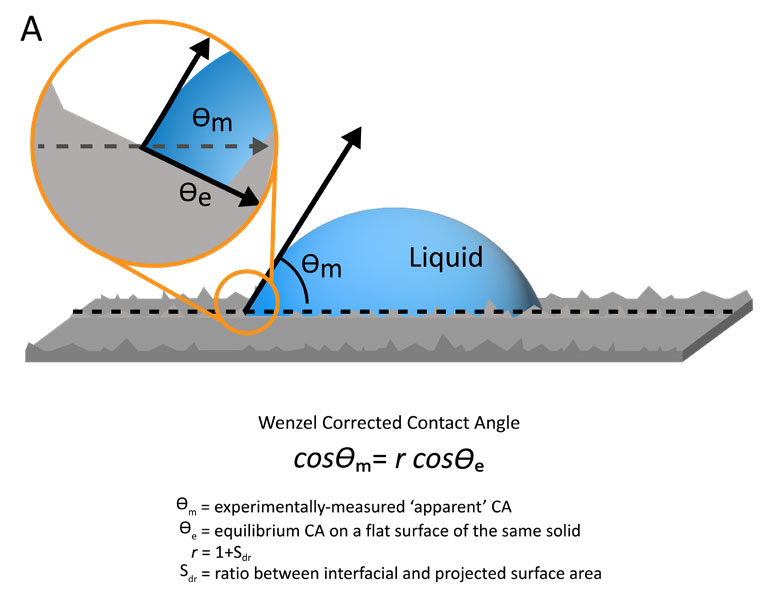
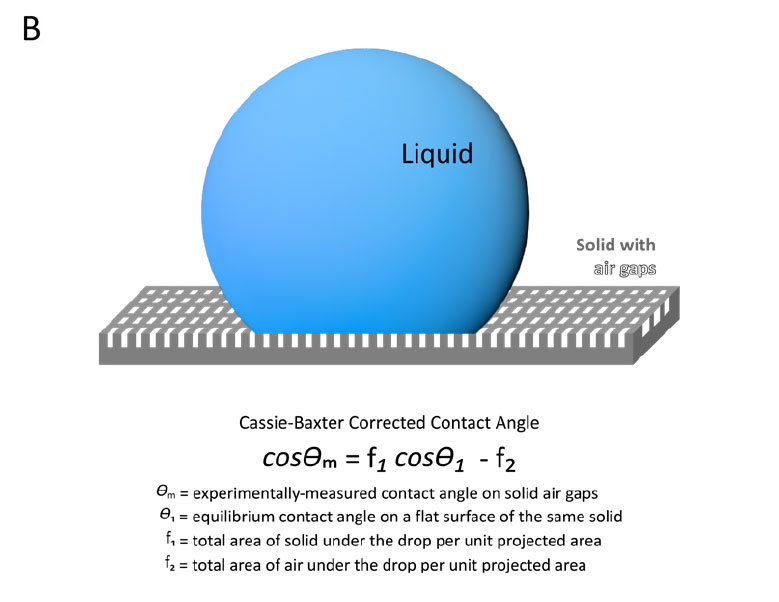
Figure 2. Diagram and equations representing the Wenzel model for fully wetting droplets (A) and Cassie-Baxter model of partially wetting droplets (B) to correct contact angle measurements on rough sample surfaces.
Practical Consideration of Roughness Correction
3D-Topography Module
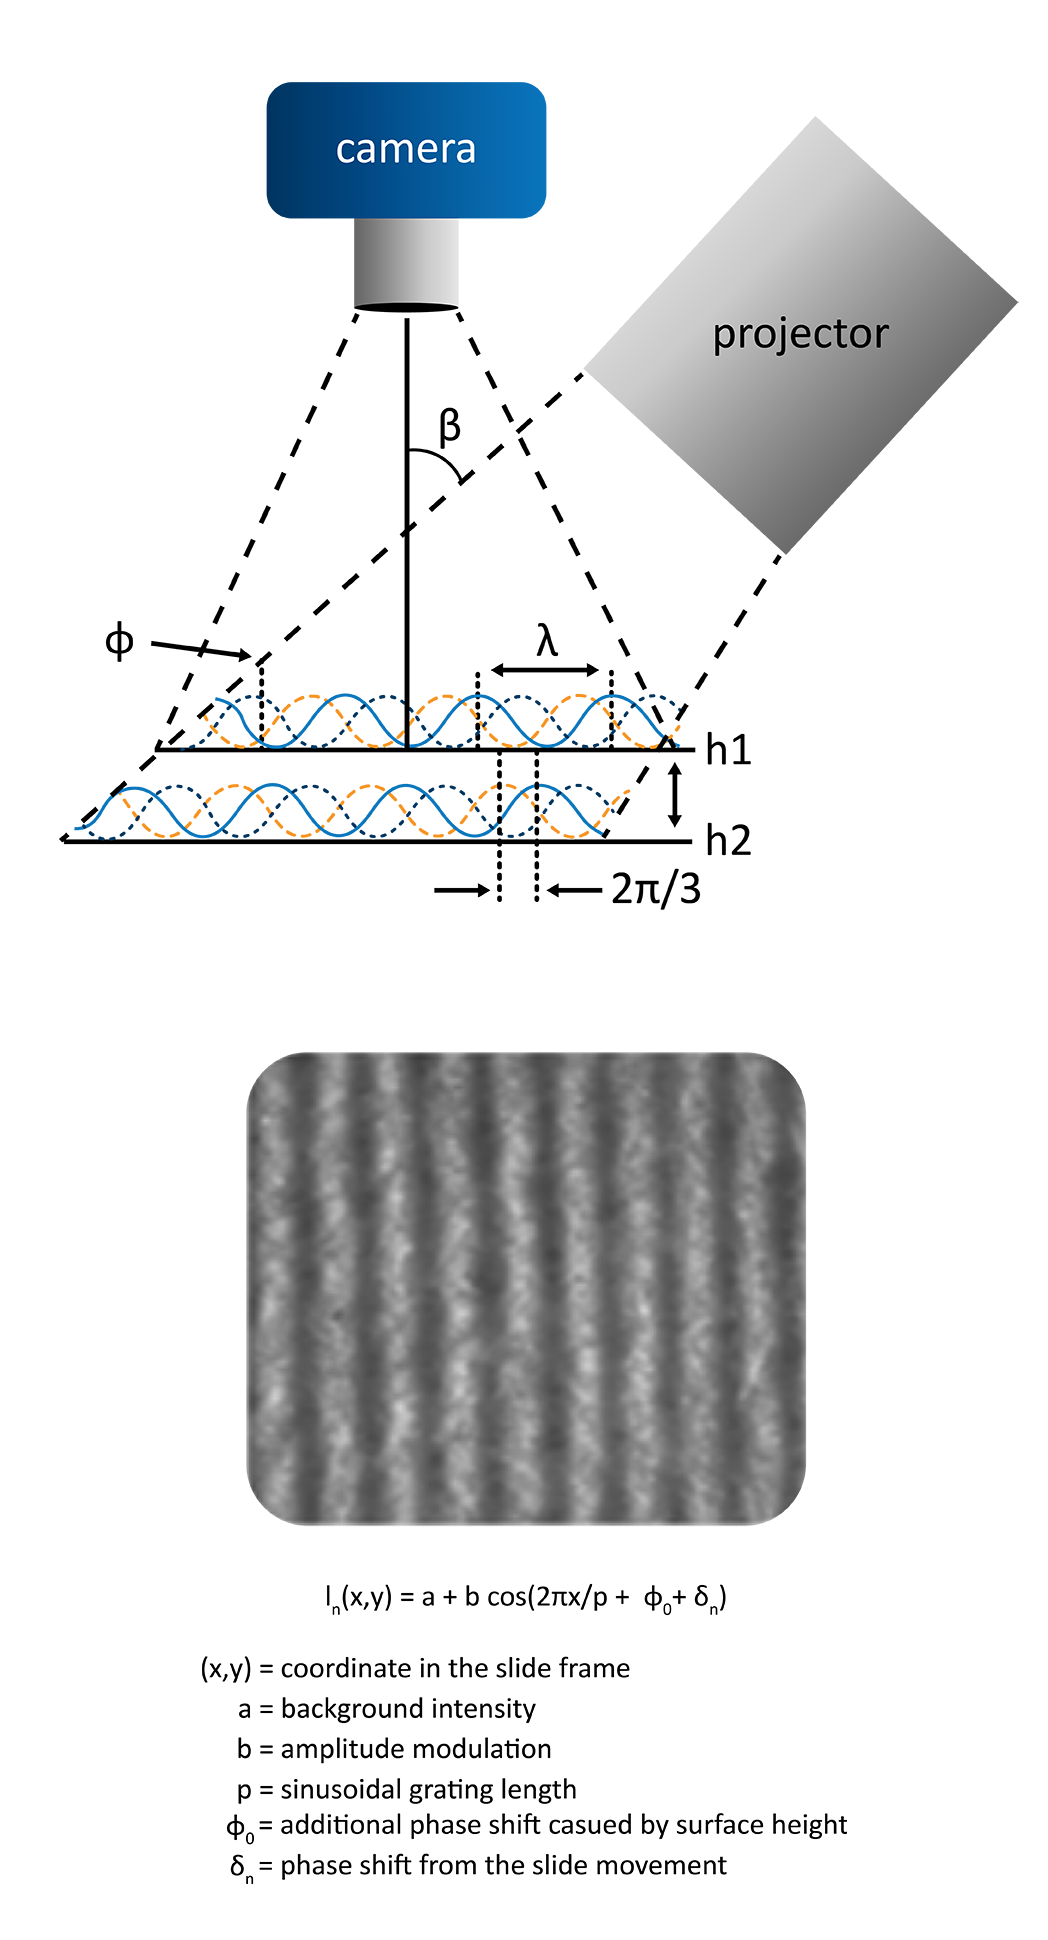
The Theta Flow or Theta Flex optical tensiometers can be equipped with the 3D-Topography module. The 3D-topography module operates as an optical profilometer, capable of standalone micron-scale surface roughness measurements or fully automated roughness corrected contact angle measurements at the exact location of the droplet placement.
Limitations of the Technique
While there are many benefits to using a fully integrated roughness correction to contact angle measurements with the Wenzel model, there are some limitations to the technique. In some cases, the Wenzel model may not apply. This is true for any non-Wenzel wetting states, where the Cassie-Baxter or a more complex model would be better suited. It is also possible for the surface to be too rough, which limits the validity of the Wenzel model. Assuming complete wetting is still occurring, the Wenzel model is most accurate as the size of the droplet is increased with respect to the surface roughness. It is best applied when the scale of the droplet is 2-3 orders of magnitude larger than the scale of the surface roughness. Beyond the Wenzel model accuracy, having too rough of a surface may also prevent the topography module from focusing properly on the sample, stopping the measurement. Like a sample that is too rough, the other primary limitation of this technique is the incompatibility of some samples with white light based optical profilometry. The 3D-topography module is ill-suited for samples that are fully reflective, fully transparent, or completely black; this technique is ideally suited for diffuse sample surfaces with micron scale roughness.
While the 3D-topography module is not able to capture nanoscale roughness, it is still possible to apply the Wenzel model to contact angle measurements even if a different technique like AFM or another profilometry method is used. All that is needed is the Sdr value, and the correction can be automatically applied to any contact angle measurement carried out with a Theta optical tensiometer. This however would not be at the same location as the droplet placement and would assume the roughness measurement is representative of the entire surface.
References
[1] Wenzel R.W., “Resistance of solid surfaces to wetting by water”, Industrial & Engineering Chemistry vol. 28, pp. 988, 1936
[2] Cassie A. B. D., Baxter S., “Wettability of porous surfaces”, Trans. Faraday Soc., vol. 40, pp. 546, 1944
[3] Milne A.J.B., Amirfazli A., “The Cassie equation: How it is meant to be used”, Advances in Colloid and Interface Science, vol. 170, no. 1–2, pp. 48-55, 2012
[4] Lafuma A., Quéré D., “Superhydrophobic states”, Nature Mater, vol. 2, pp. 457–460, 2003
[5] Zhang S., Huang P., “High-resolution, real-time 3D shape acquisition”, Computer vision and pattern recognition Workshop, 2004