Geological samples are complex matrices of minerals, each with their own unique compositions and structures. Phase identification, in a general sense, is the process of highlighting these differences to better understand geological formations and processes. Many techniques and instruments are employed by geologists to identify the phases in their samples, including scanning electron microscopy (SEM) paired with energy dispersive X-ray spectroscopy (EDS).1 While EDS is useful for analyzing the surface chemistry of geological samples, distinguishing multiphase minerals within a sample remains challenging due to ambiguous interpretations that come with localizing the many elements present on colorized EDS maps.
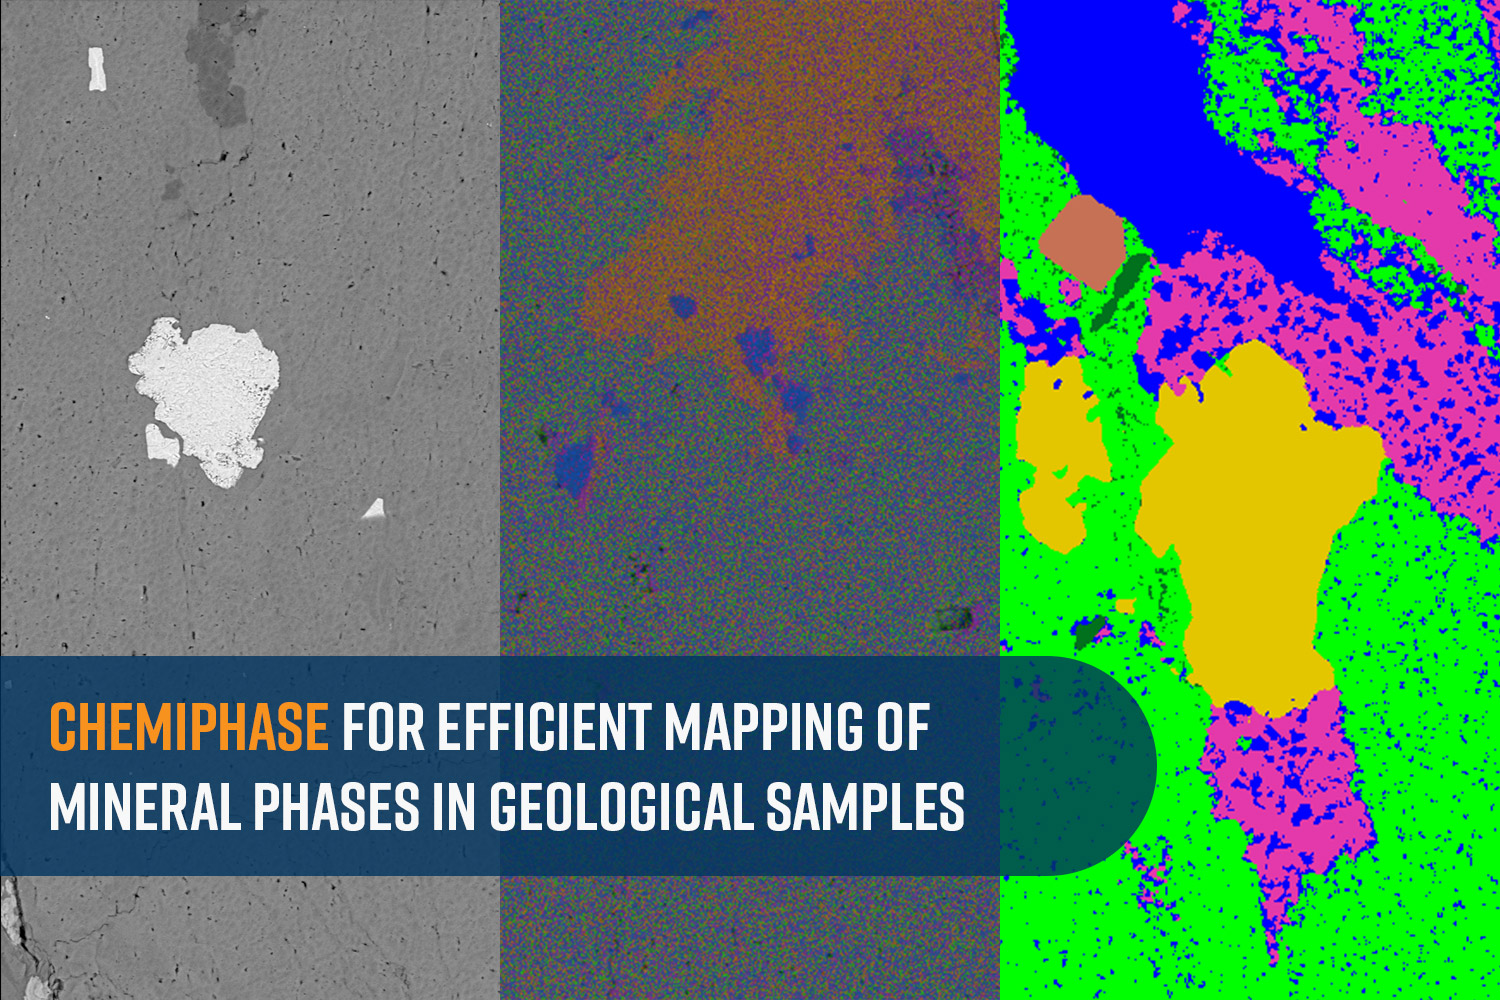
ChemiPhase, a new software capability on the Phenom Desktop SEMs, addresses the challenge of Phase mapping. The analytical EDS datasets are used to group pixels based on spectral similarity, producing clear and accurate visual distinctions between different material phases. This blog describes ChemiPhase and its capacity to streamline phase identification processes in geological applications, along with examples showcasing the results of ChemiPhase.

Understanding Phase Mapping and Its Applications in Geology
Mineral identification is a core process for geologists to understand the complex history of geological formations. Various geologic environments and processes can result in several mineral types, each with their own unique history. Discerning these distinct mineral phases and their relative history is so complex, that an entire field of study, known as mineralogy, is solely dedicated to deciphering these mysteries. Discerning distinct mineral phases is particularly important when dealing with samples that are composed of multiphase materials; each contributing to the complexity of a geologic deposit’s history. Some of the key areas in which mineral phase identification finds great utility include:
- Astronomy: Mineral phase analysis on extra-planetary fragments can reveal how the universe was formed.
- Economic Geology: Presence of certain minerals together can be indicative of a high-quality ore deposit.
- Geochronology: Analyzing mineral phases to determine the age and history of geological specimens.
- Volcanology: Analyzing volcanic rocks, ash deposits, and alteration of volcanic materials can help in understanding the composition of the Earth’s interior.
Geologists utilize a varied toolset to classify mineral phases in a sample including:
- Combination of SEM and EDS.
- X-ray diffraction (XRD),2 a method helpful in obtaining crystal structure information.
- X-ray fluorescence (XRF) paired with wave dispersive spectroscopy (WDS) for elemental data of a bulk sample.
- Electron Micro Probe (EMP) paired with WDS for highly quantitative data.
- Raman spectroscopy for molecular composition and structural information.
Phenom Desktop SEM with ChemiPhase
Phenom Desktop SEMs, with the integration of high resolution SEM imaging and EDS capabilities, are particularly suited for identifying distinct mineral phases in geological samples. The advanced software provides a user-friendly interface, enabling geologists to perform fast phase mapping with minimal training.
When analyzing complex multiphase materials using SEM with EDS, distinguishing between overlapping elemental signals can be challenging. Traditional EDS mapping of these types of samples often results in a convoluted display of colors, making it difficult to interpret the data accurately. The solution to this problem lies in calculating the material phases present in the sample. This process utilizes a technique called principal component analysis (PCA) to simplify the analytical dataset and highlight hidden trends. PCA reduces the complexity of the data by transforming it into principal components, which represent the most significant variations within the dataset. In phase mapping, the EDS analysis generates spectral data for each pixel in the image. After the user chooses the initial number of phases, the software then calculates the chemical phases by grouping pixels with similar spectra, regardless of their exact individual quantification results. This approach ensures that pixels with comparable spectral characteristics are combined into distinct phases. The result is a map where each phase is represented by a unique color, making it much easier to interpret the material’s composition.
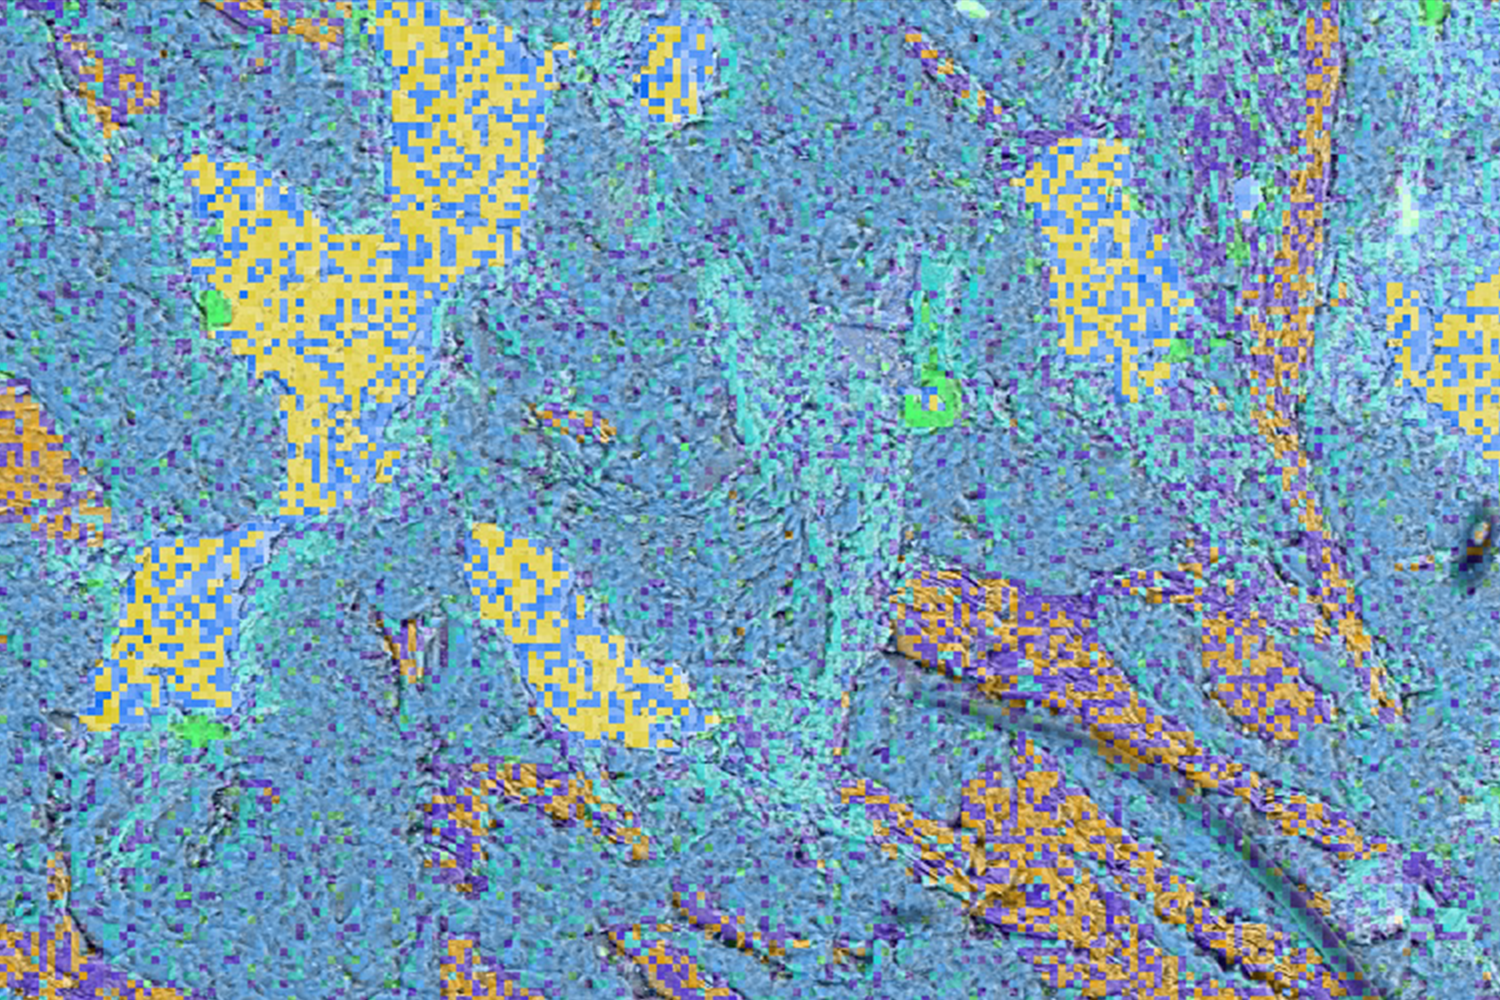
For example, in an EDS map of a mineral sample (Figure 1), areas rich in rubidium, arsenic, or nickel may be evident, but the localization of other elements can be obscured due to their widespread occurrence across the sample. When multiple colors are overlaid, the resulting image can be ambiguous, with some regions appearing distinctly colored while others blend into a confusing mix.
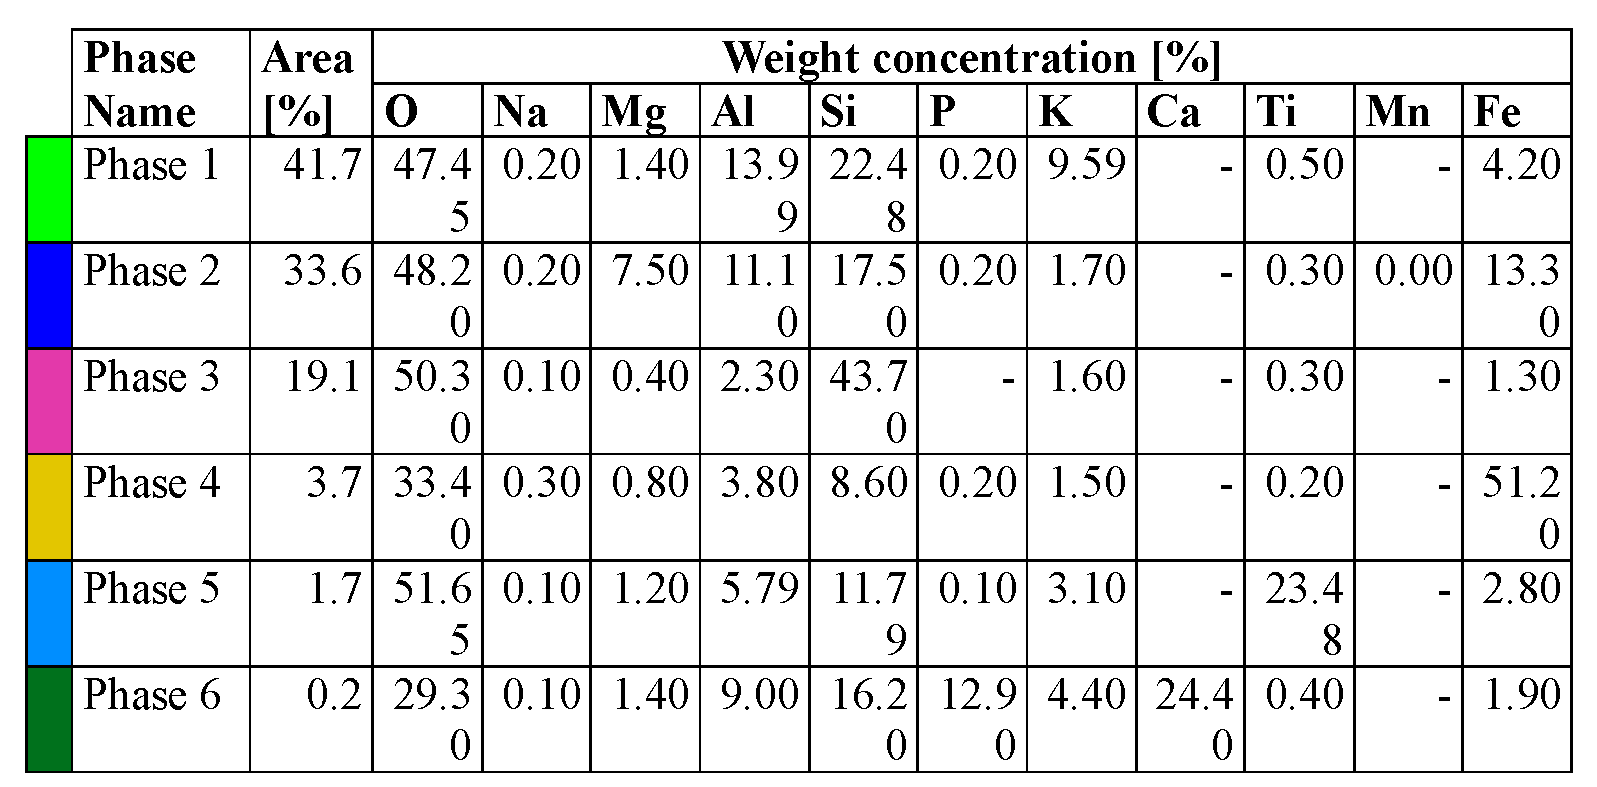
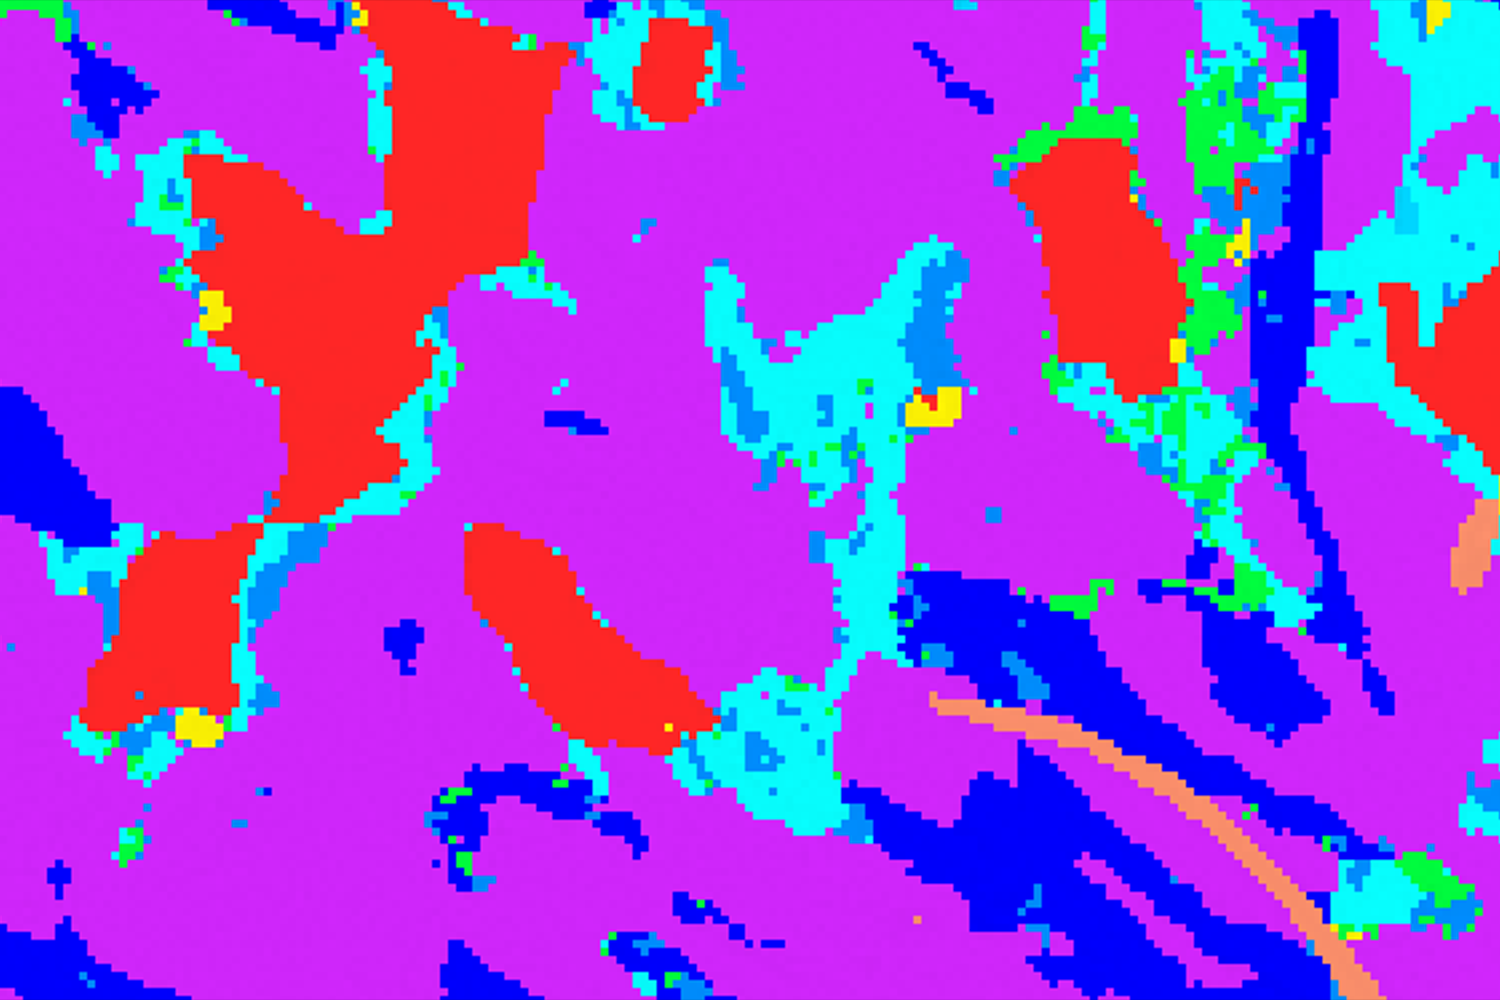
In another example, Figure 2, a rock sample was polished using a SEMPrep2 ion milling system to clean the surface of amorphous material. Once ion milled, the rock was then subjected to EDS analysis to yield a colorized phase map consisting of six total phases. The data obtained from this phase map was automatically compiled into an EDS report. Table 1 highlights each one with the weight concentration of elements (O, Na, Mg, Al, Si, P, K, Ca, Ti, Mn, and Fe), in addition to the area percentage covered in the image by a particular phase.
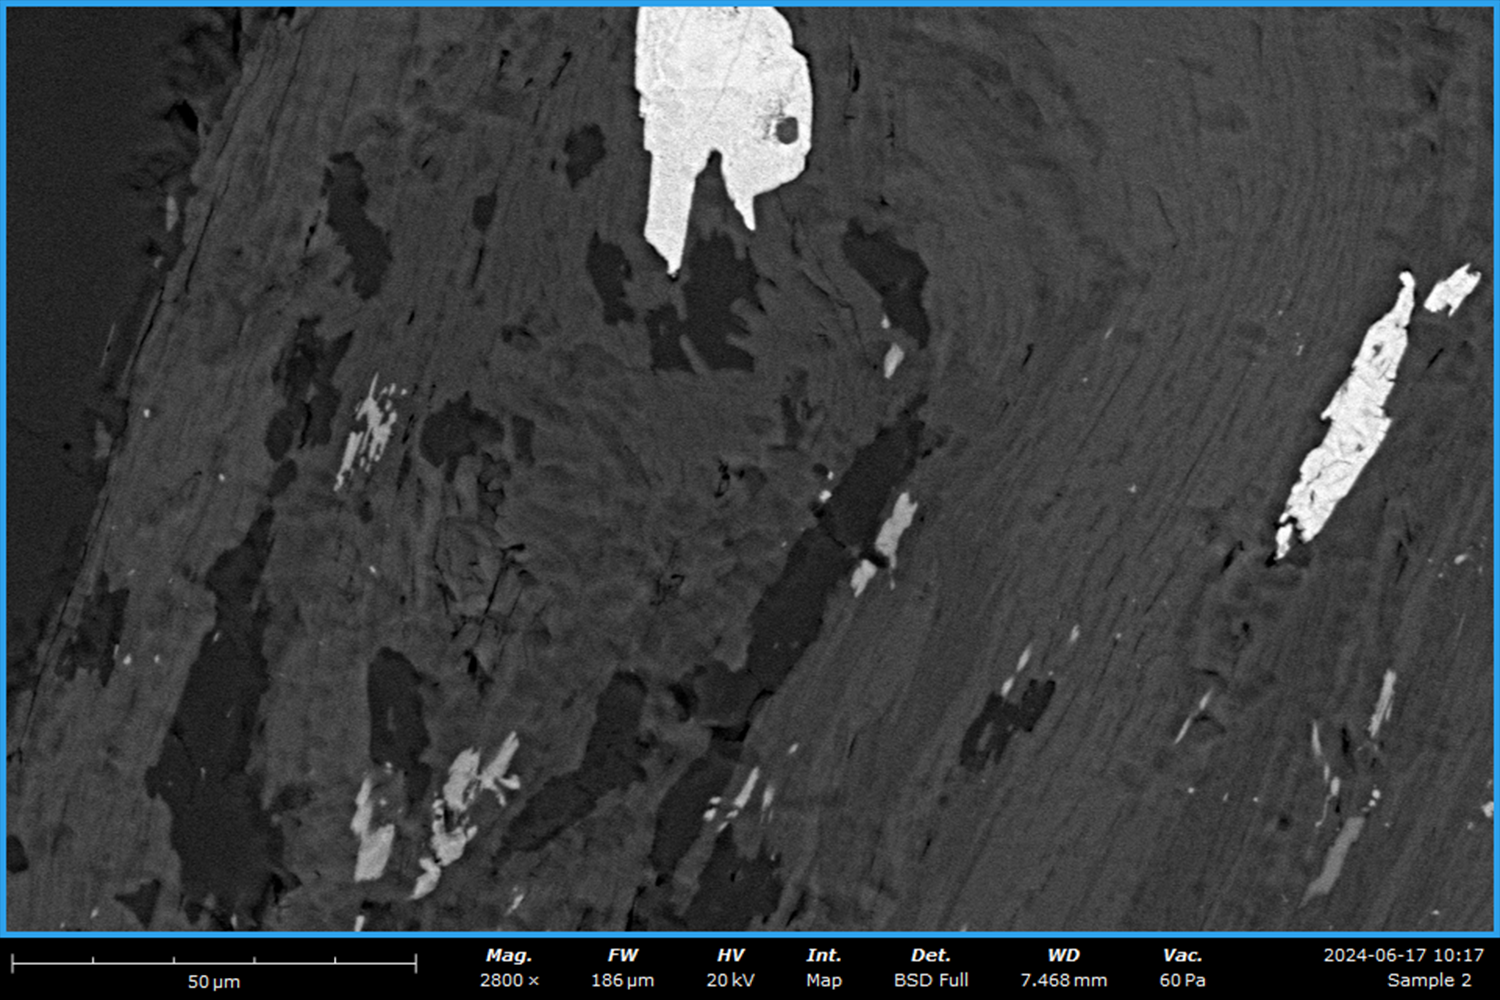
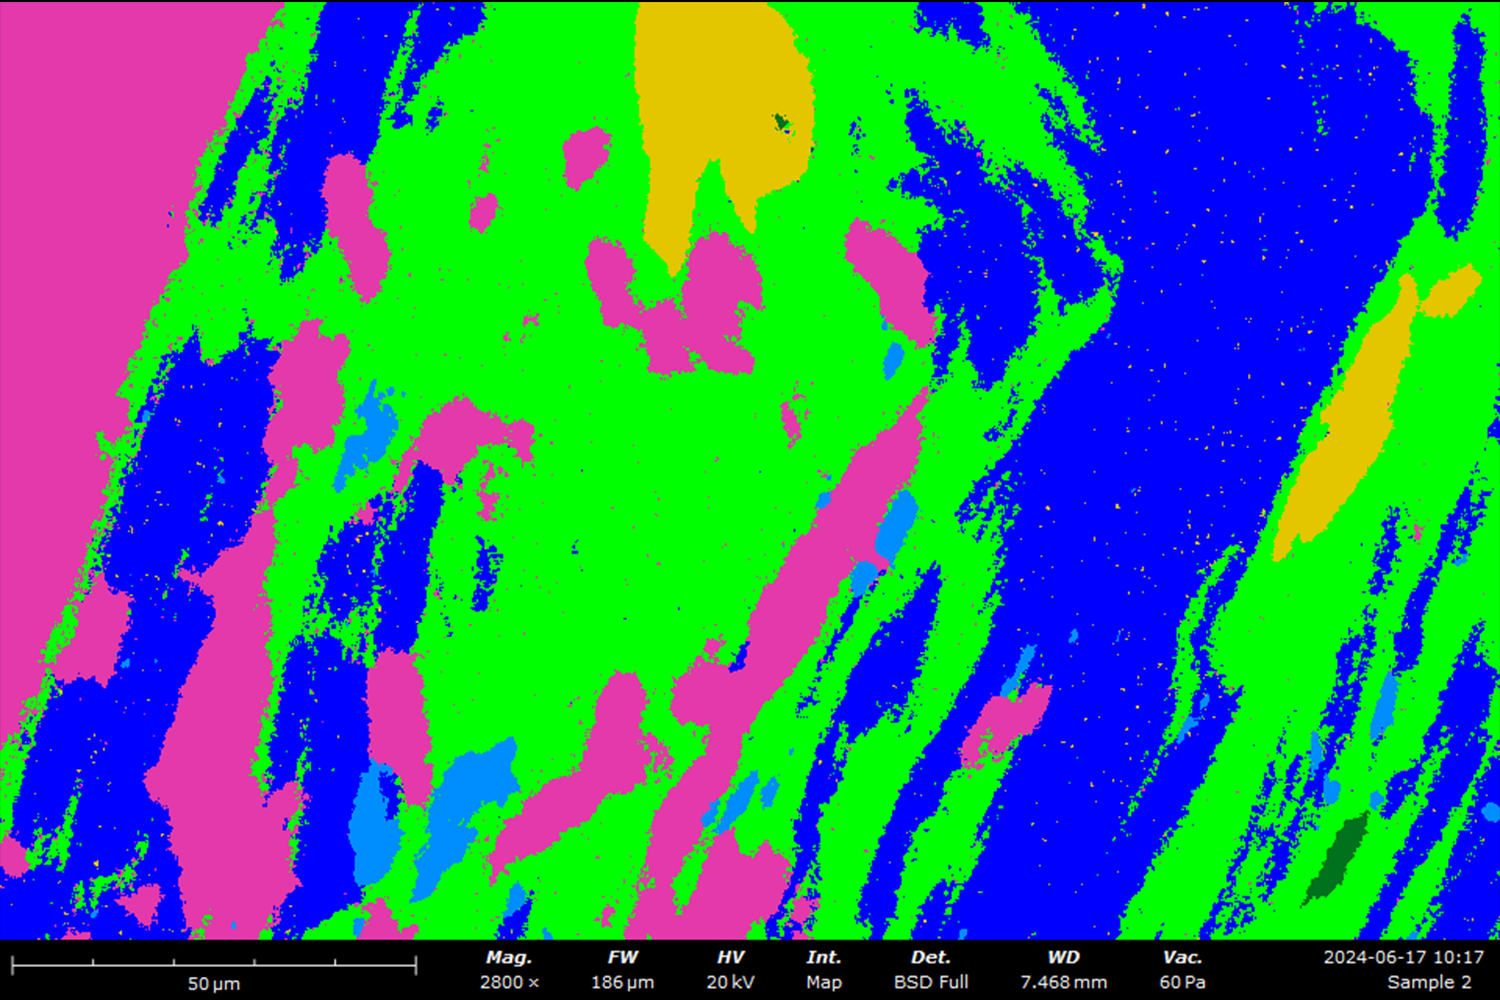
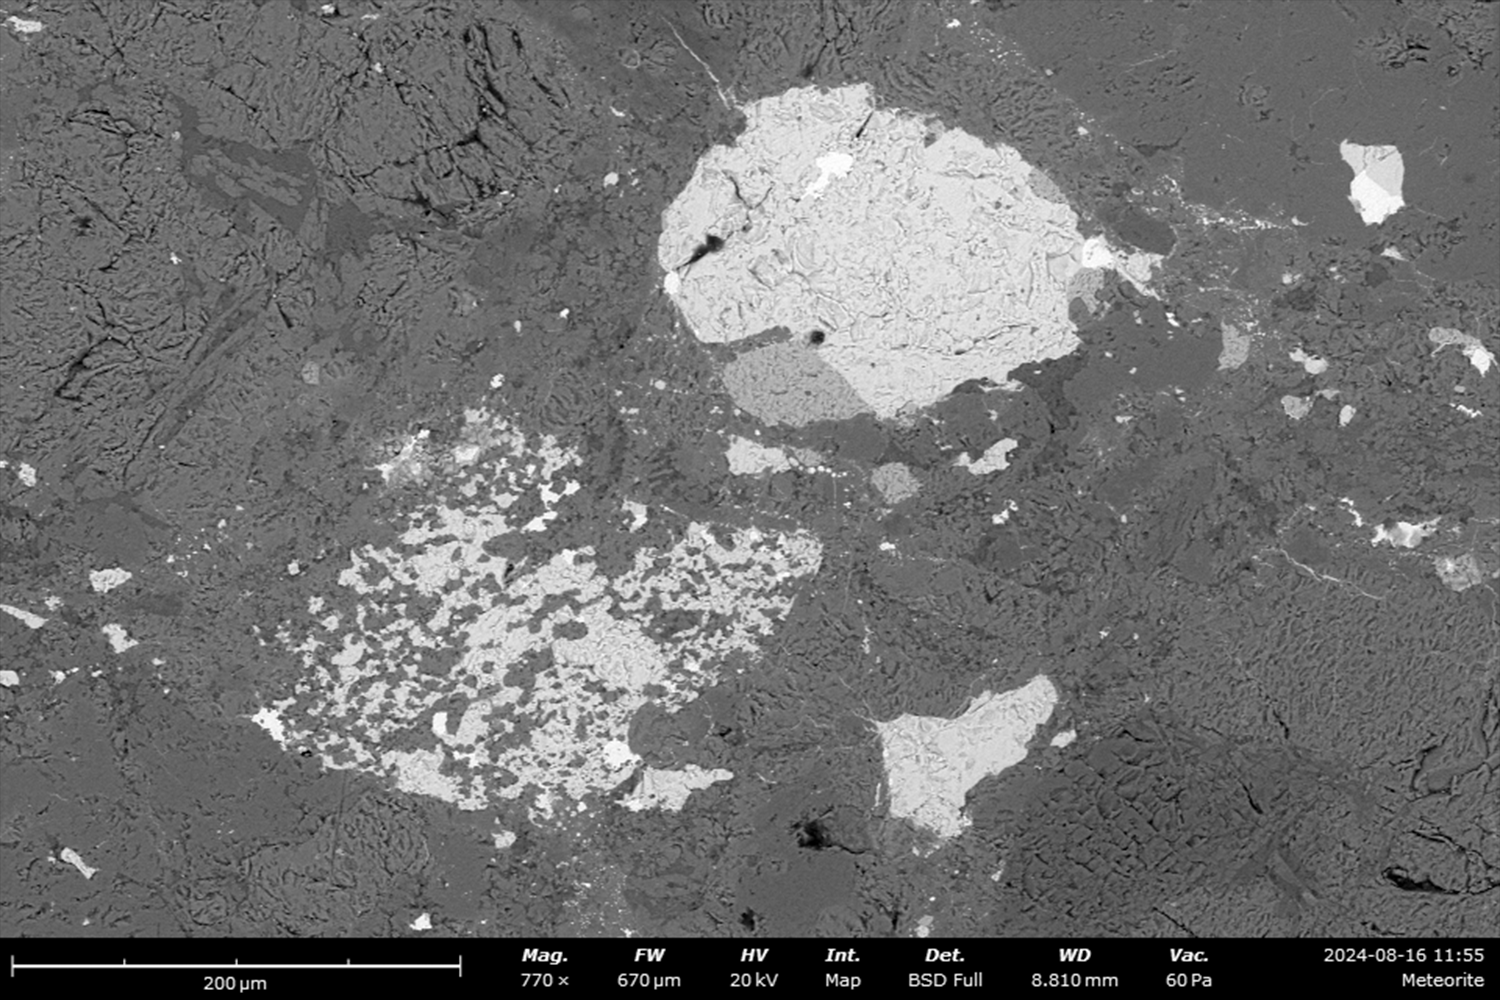
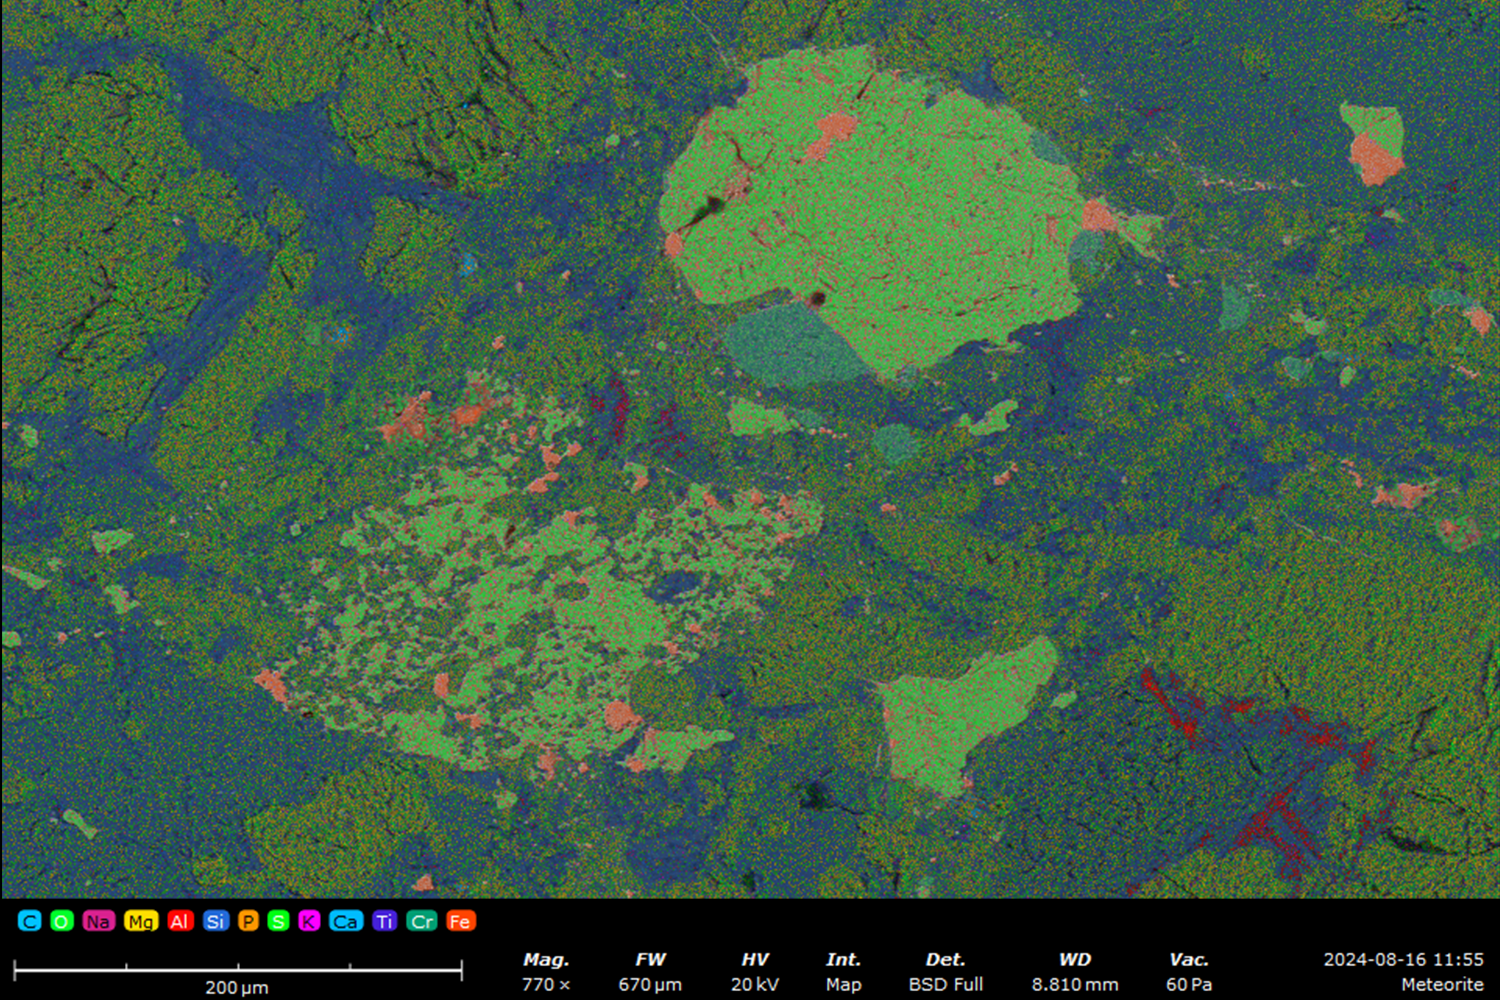
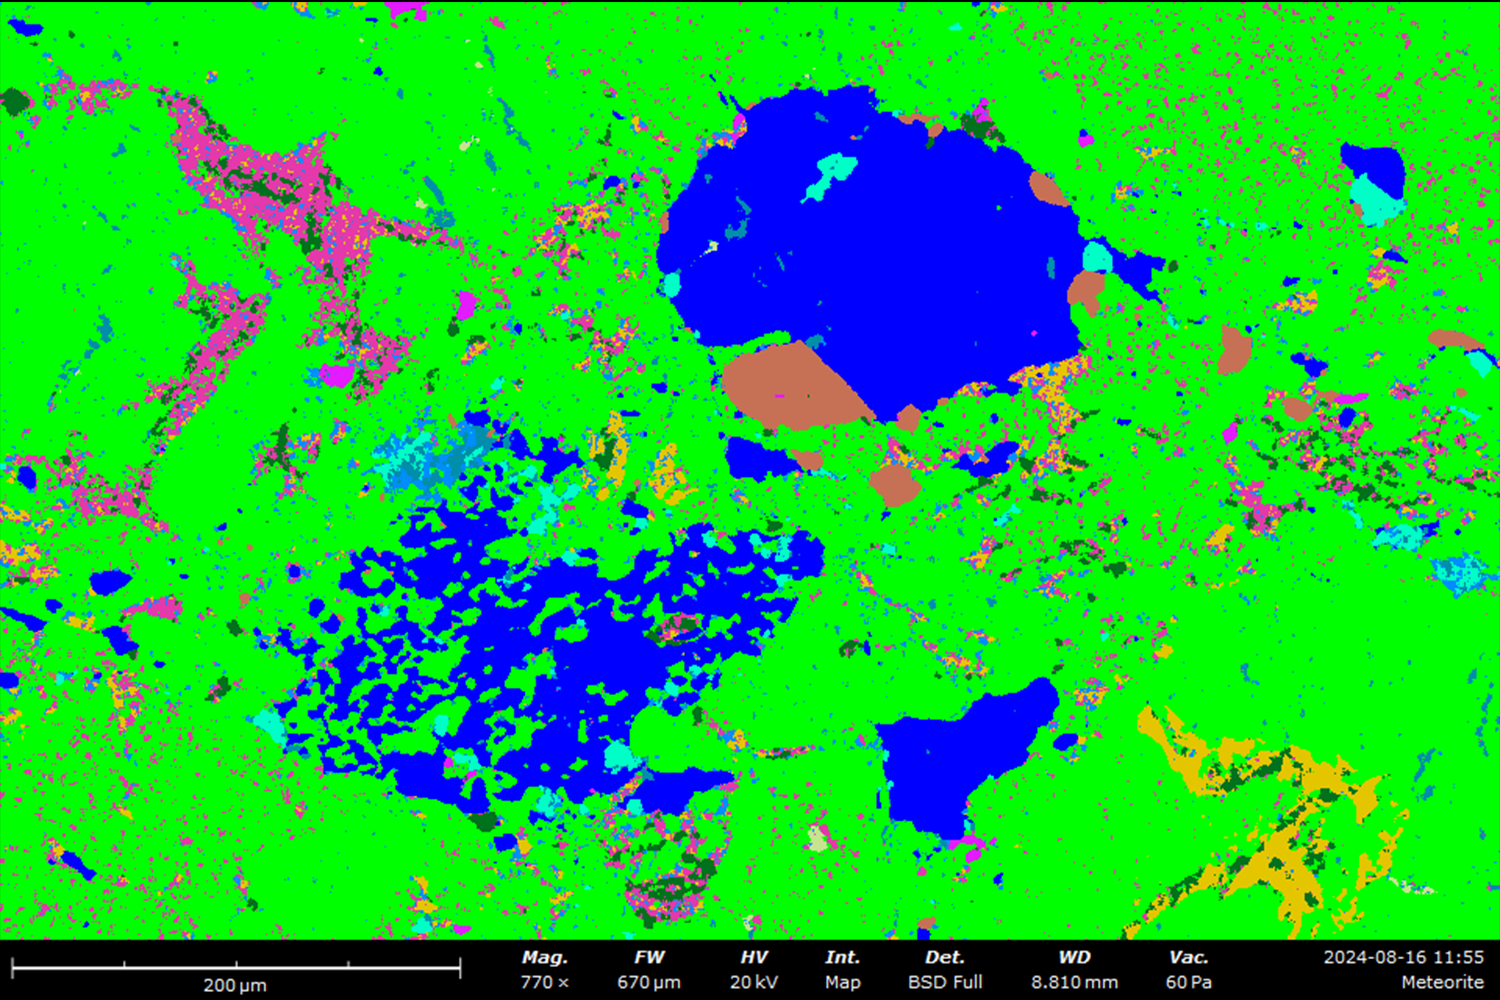
Figure 3 shows a BSD image, EDS map, and phase map of a meteorite sample. Originally found in Nigeria, this chondrite meteorite sample was found by the village of Aba Panu and is thus named after it. Of composition, it is a petrologic type L 3.6 chondrite meteorite and has a significant Cr2O3 content in olivine. Chondrites are stony, non-metallic meteorites and are estimated to have formed during the formation of the solar system. They contain a wide variety of minerals, but most are rich in olivine and pyroxene. According to the meteorite classification system, this type of meteorite is the most common to fall on Earth.
Conclusion
The phase mapping software on Phenom Desktop SEMs transforms complex EDS datasets of geological materials into clear, interpretable maps. By grouping pixels based on spectral similarity, ChemiPhase rapidly simplifies the identification of mineral phases, making it an invaluable asset for geologists analyzing multiphase samples.
References
- Haberlah, D., Owen, M., Botha, P.W., Gottlieb, P. (2012). Sem-Eds-Based Protocol for Subsurface Drilling Mineral Identification and Petrological Classification. In: Broekmans, M. (eds) Proceedings of the 10th International Congress for Applied Mineralogy (ICAM). Springer, Berlin, Heidelberg. https://doi.org/10.1007/978-3-642-27682-8_33 ↩︎
- Harris, W. and Norman White, G. (2008). X-ray Diffraction Techniques for Soil Mineral Identification. In Methods of Soil Analysis Part 5—Mineralogical Methods (eds A.L. Ulery and L. Richard Drees). https://doi.org/10.2136/sssabookser5.5.c4 ↩︎