
Quartz Crystal Microbalance with Dissipation Monitoring (QCM-D) is a powerful sensing technique that allows researchers to investigate real time changes in nanoscale mass and viscoelastic properties of thin films at surfaces and interfaces. QCM-D utilizes a quartz crystal that that is excited to its resonance frequency by applying a drive voltage and then allowed to freely oscillate by turning the drive voltage off until sensor comes to a complete rest. The process, also referred to as “pinging”, is repeated periodically at intervals of a few milliseconds. The changes in oscillation frequency and the rate of oscillation decay (dissipation) are measured during surface interactions that reveal the mass and viscoelastic properties of the material adhered to the sensor surface.1 This blog delves into how changes in frequency and dissipation relate to changes in mass and viscoelastic properties.

Changes in Frequency
When mass is either added or removed from the sensor surface the resonant frequency changes. Interpreting the changes in frequency in QCM-D measurements involves understanding how these changes relate to mass, thickness, and the viscoelastic properties of the material on the sensor surface. Few of the key aspects to consider include:
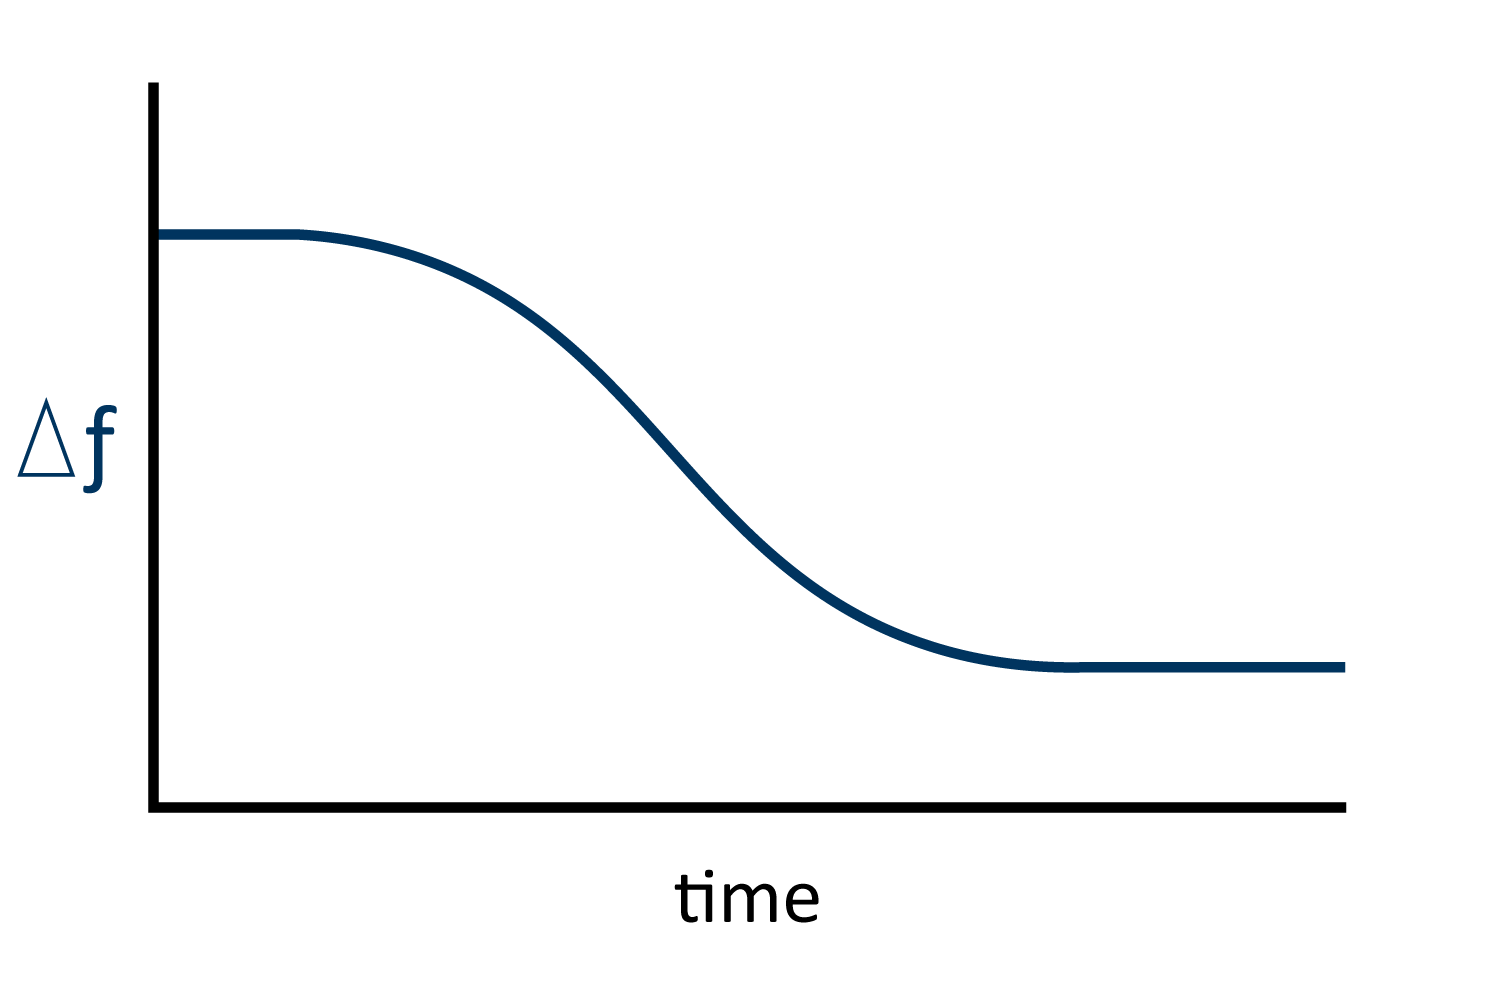
- Basic Principle of Frequency Change: In QCM-D, a quartz crystal sensor oscillates at its resonant frequency. When a mass, such as molecules or particles, attaches to the sensor surface, the oscillation frequency decreases. Similarly, when the mass is removed, the oscillation frequency increases (Figure 1). This frequency change (Δf) is directly related to the change in mass.
- Mass Change: For rigid, thin, and evenly distributed layers, the relationship between the frequency change and the mass change can be described by the Sauerbrey equation:
Δm | = – | CΔf | ||
n | ||||
Where:
Δm is the change in mass per unit area (ng/cm²),
C is the sensitivity constant of the quartz crystal (typically 17.7 ng/(Hz·cm²) for a 5 MHz crystal in air)
Δf is the change in frequency (Hz)
n is the harmonics number (usually 1, 3, 5, etc.).
This equation assumes that the added layer is rigid and does not significantly dissipate energy (i.e., low viscoelastic loss).2 When the adsorbed layer is not rigid (e.g., a soft or viscous film), the Sauerbrey equation becomes less accurate. In the case of soft or viscous layers, a larger shift in frequency than predicted by Sauerbrey equation, is observed. This is due to some energy being dissipated in the layer. Analyzing such films requires modeling of both frequency and dissipation data using viscoelastic models.
- Multilayer or Complex Films: Interpreting frequency changes for multilayer or complex films can be challenging because of non-uniform distribution of mass on the sensor and different layer having varying densities and viscoelastic properties, complicating the direct correlation between frequency change and mass.
- Using Multiple Harmonics: Measuring frequency changes at multiple harmonics of the fundamental resonance frequency can provide additional information. If consistent frequency shifts are observed across multiple harmonics, it would suggest a uniform rigid layer. However, if diverging frequency shits are observed, it would suggest viscoelastic behavior or a heterogeneous film structure.
Energy Dissipation:
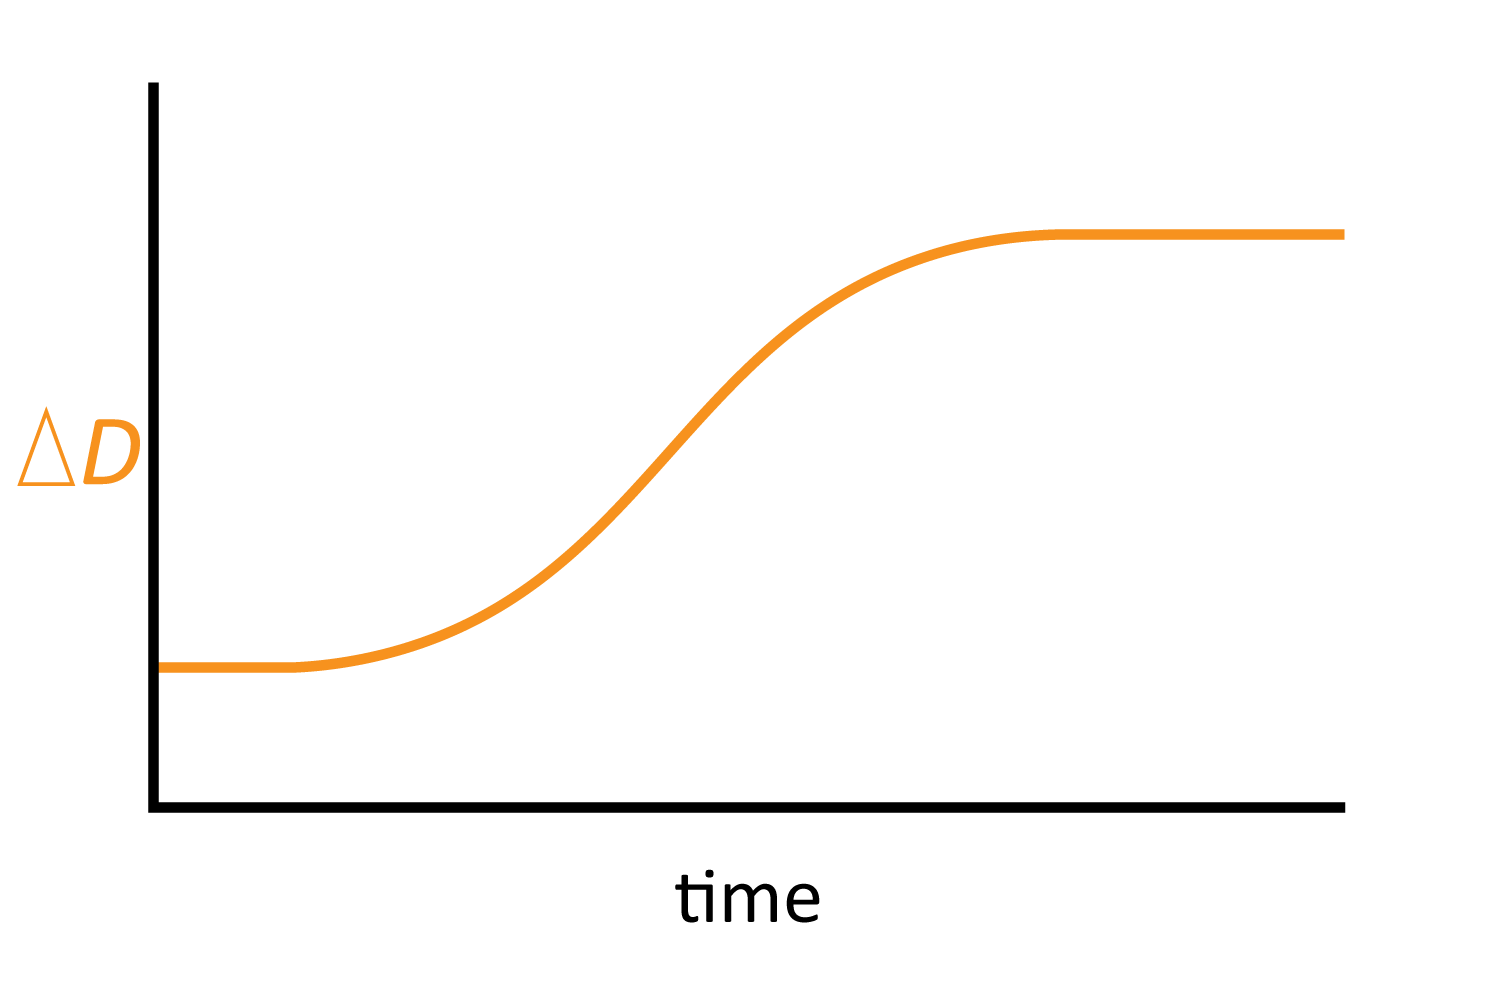
QCM-D measurements also record the dissipation factor (D), which indicates energy loss in the system due to internal friction and deformation within the layer (Figure 2). Dissipation (D) provides insight into the viscoelastic properties of the material layer attached to the sensor surface. High dissipation change suggests a viscoelastic (soft or hydrated) film, whereas a low dissipation change indicates a more rigid film.
- Understanding Dissipation: Dissipation (D) measures the energy loss in the system, expressed as:
D | = | Elost | ||
2πEstored | ||||
Where:
Elost is the energy lost per oscillation cycle,
Estored is the energy stored in the oscillating system.
A higher dissipation value means more energy is lost, suggesting that the layer is more viscoelastic (soft, viscous, or hydrated), whereas a lower dissipation value indicates a more rigid and elastic layer.
- Interpreting Dissipation Changes (ΔD): A low dissipation change indicates that the layer is rigid and elastic, and the energy loss is minimal. It indicates the material does not significantly deform or absorb energy, for example, stiff polymers, dense films, or strongly bound biological molecules. A high dissipation change suggests that the layer is soft, viscous, or contains a significant amount of water or other solvents. It indicates substantial energy loss due to internal friction and deformation within the layer. Common materials that exhibit a large dissipation change are soft polymers, hydrated biological layers, or loosely bound molecular assemblies.
Correlation of Frequency Changes (Δf) and dissipation changes (ΔD):
To gain a comprehensive understanding, frequency data should be interpreted alongside dissipation data.
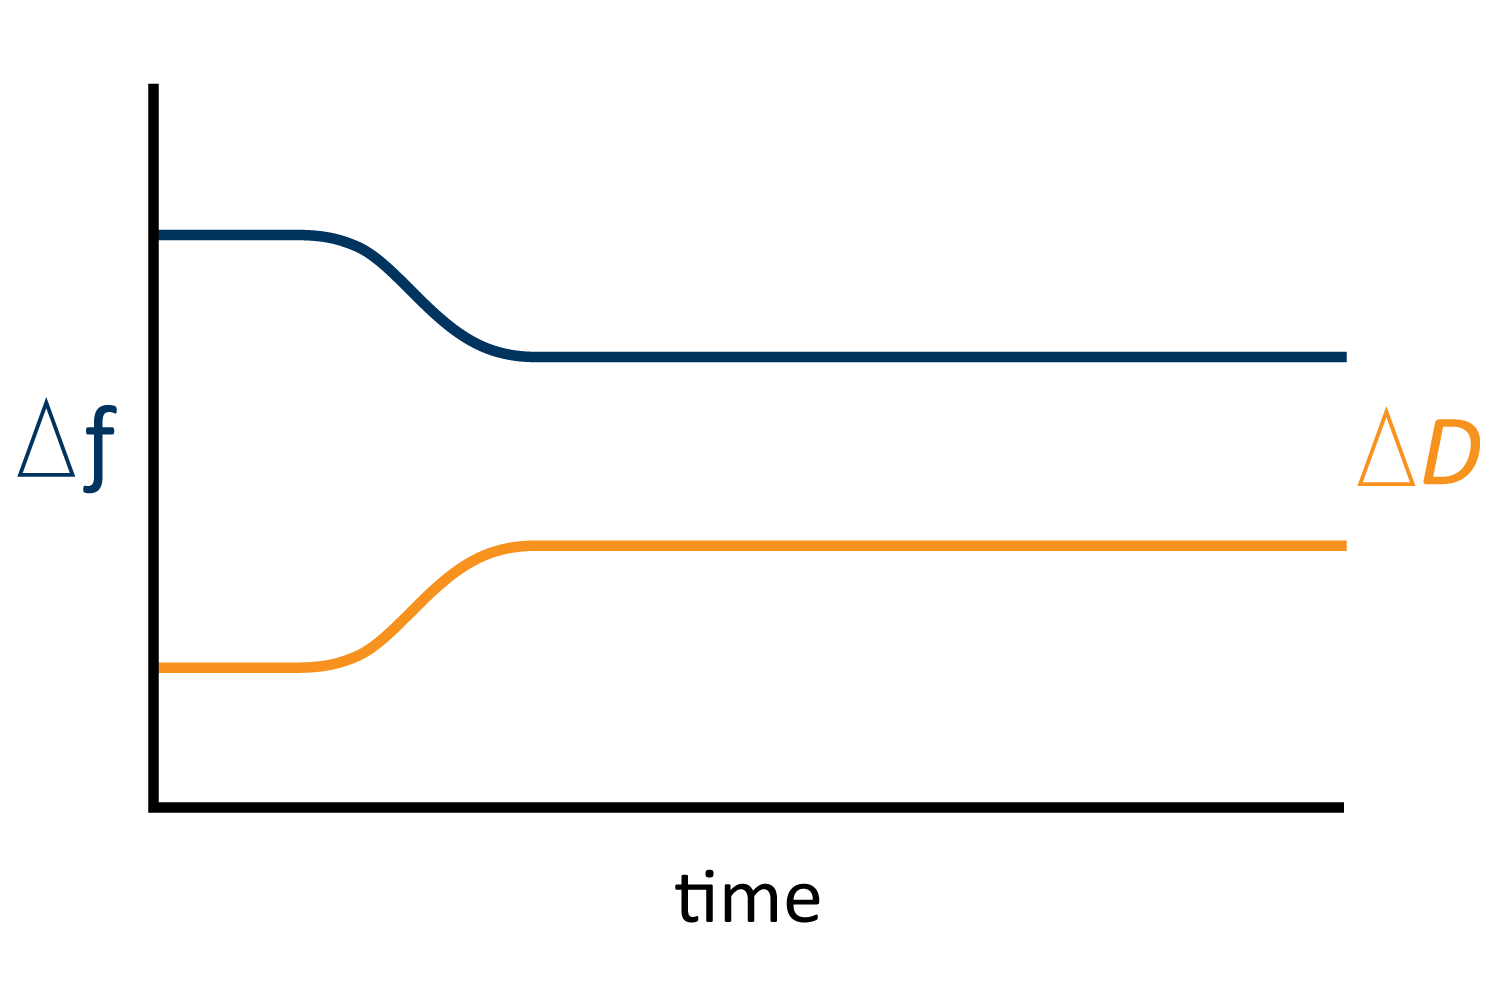
- Low Decrease in Δf and Low Increase in ΔD: This indicates the formation of a stable, rigid or very thin film that adds minimal mass on to the sensor (Figure 3).
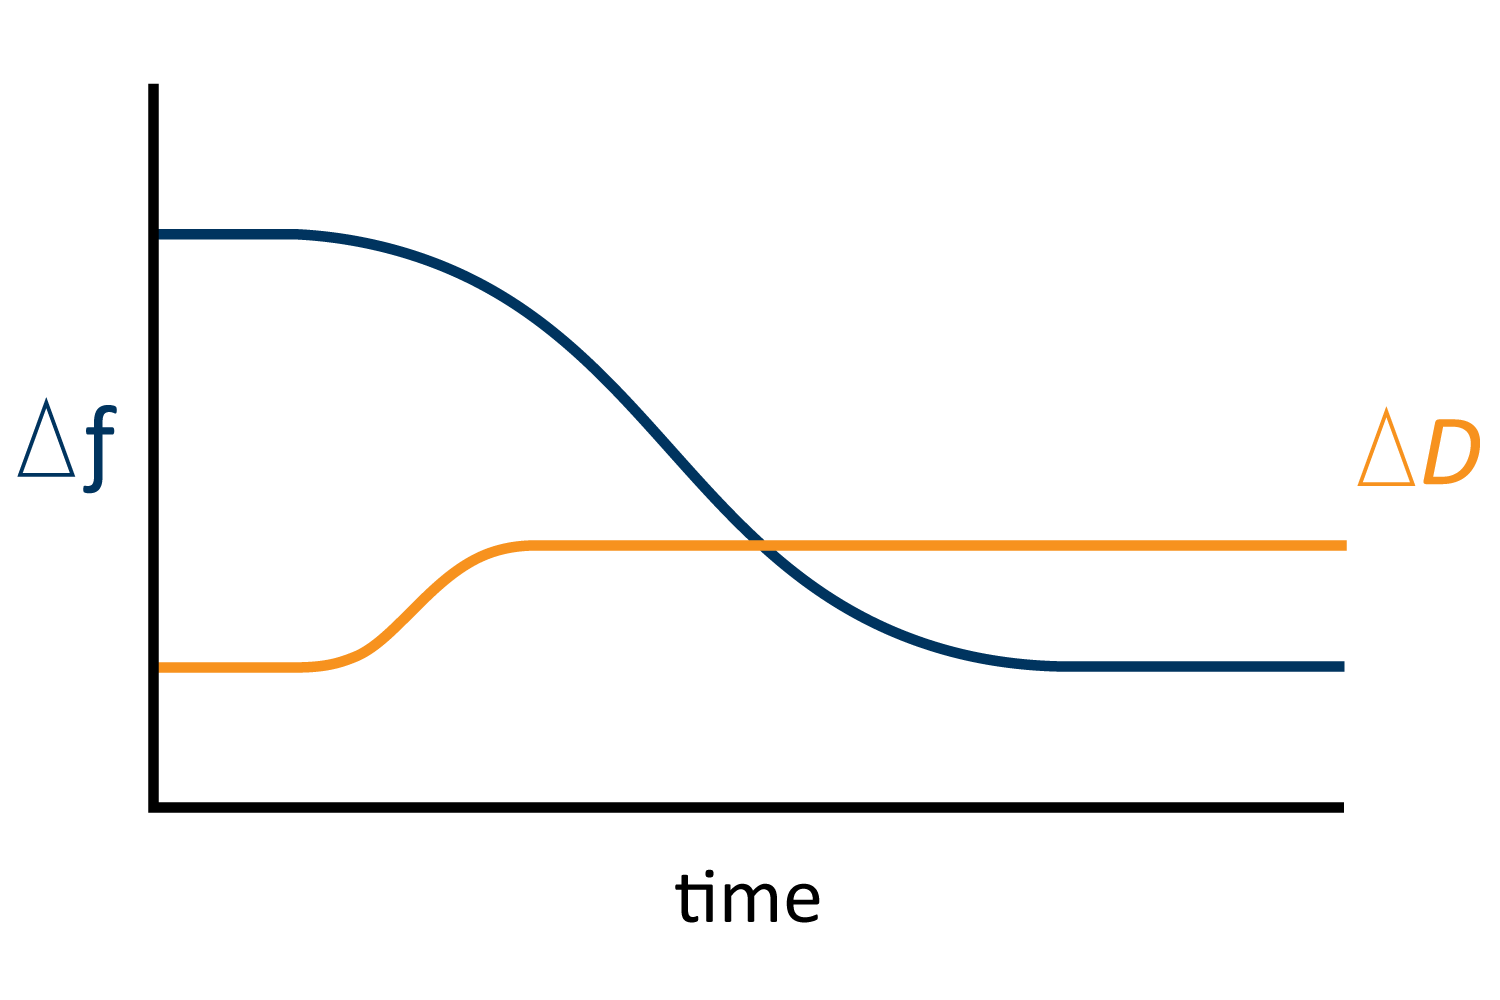
- High Decrease in Δf and Low Increase in ΔD: This indicates the formation of a rigid layer that adds significant mass on the sensor. This situation might occur when a dense, stiff film forms such as a thick protein layer or a dense polymer coating (Figure 4).
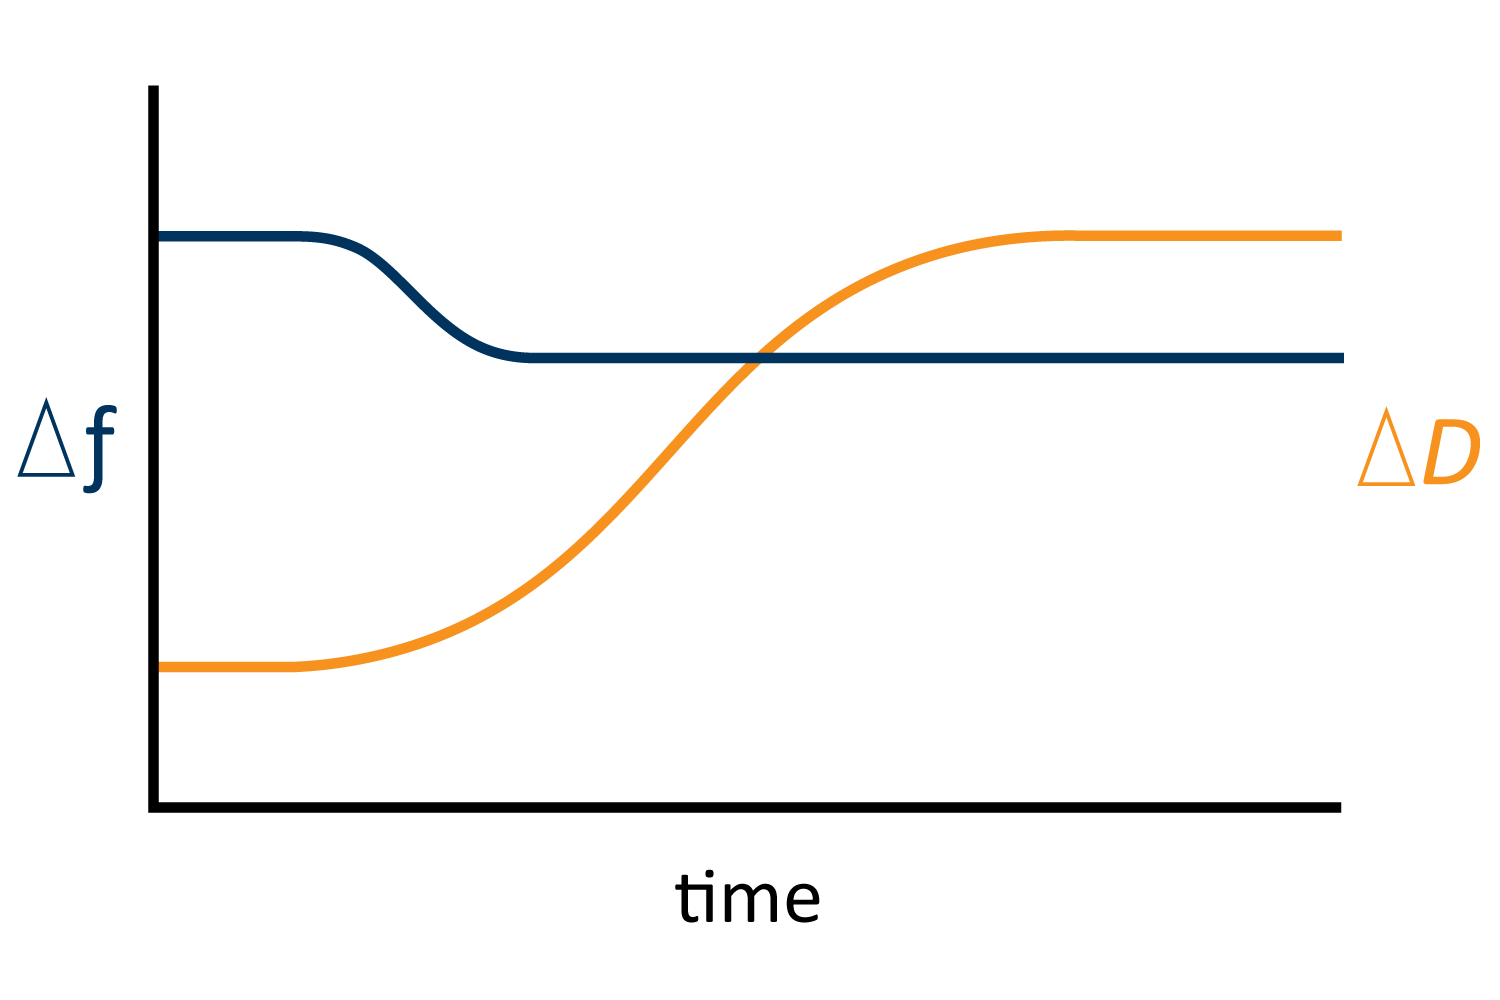
- Low Decrease in Δf and High Increase in ΔD: This indicates that the added layer has low mass but high viscoelasticity. It could be a thin, soft, or loosely bound layer that does not contribute much to the overall mass but affects the system’s viscoelastic properties, such as a hydrated polymer brush or changes in cell membrane (Figure 5).
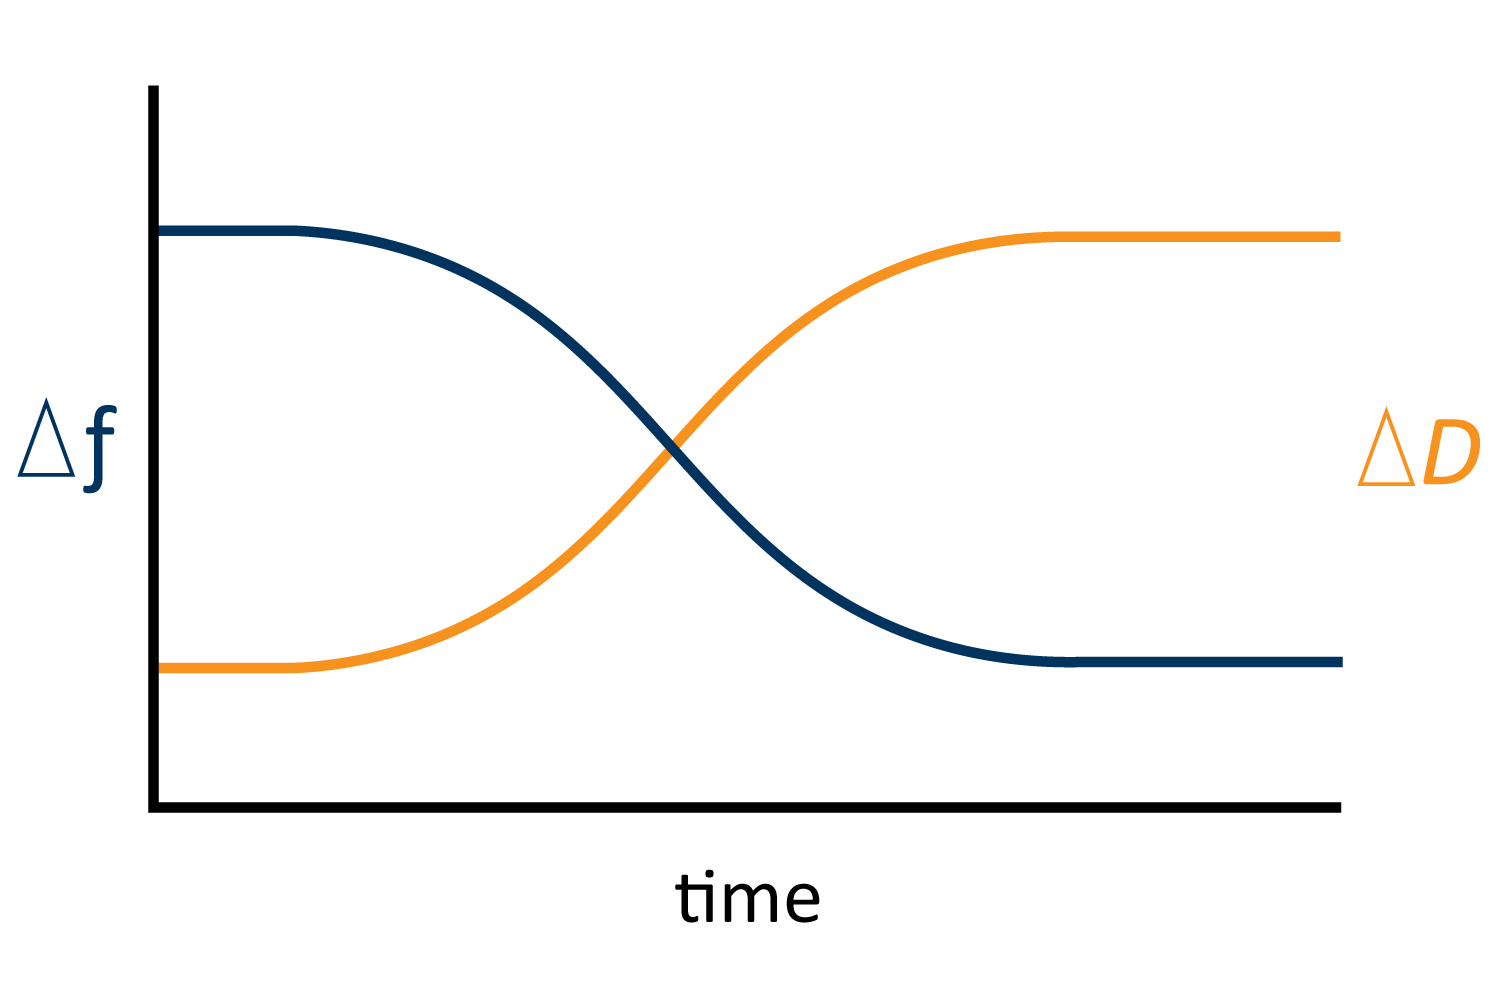
- High Decrease in Δf and High Increase in ΔD: This indicates that the added layer is both heavy and viscoelastic. It often is a thick, soft, or hydrated layer, such as a gel or a polymer film that absorbs water. In these cases, the simple mass-frequency relationship breaks down, and more complex models are needed (Figure 6).
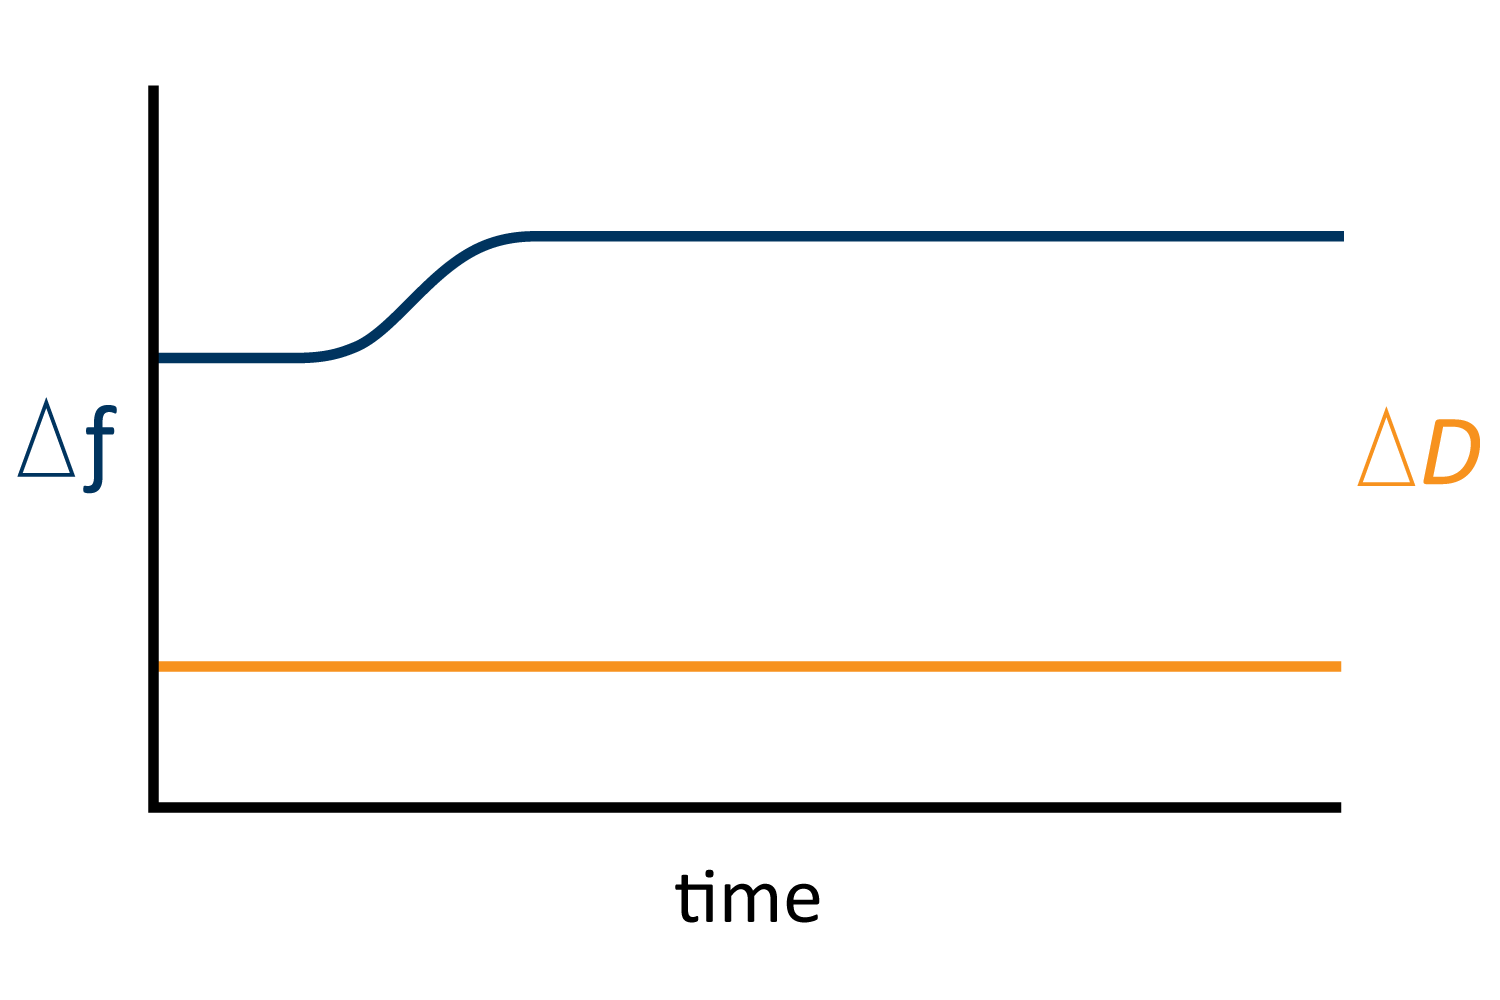
- Increase in Δf and No Change in ΔD: This indicates etching of a hard surface for example, etching of glass or copper (Figure 7).
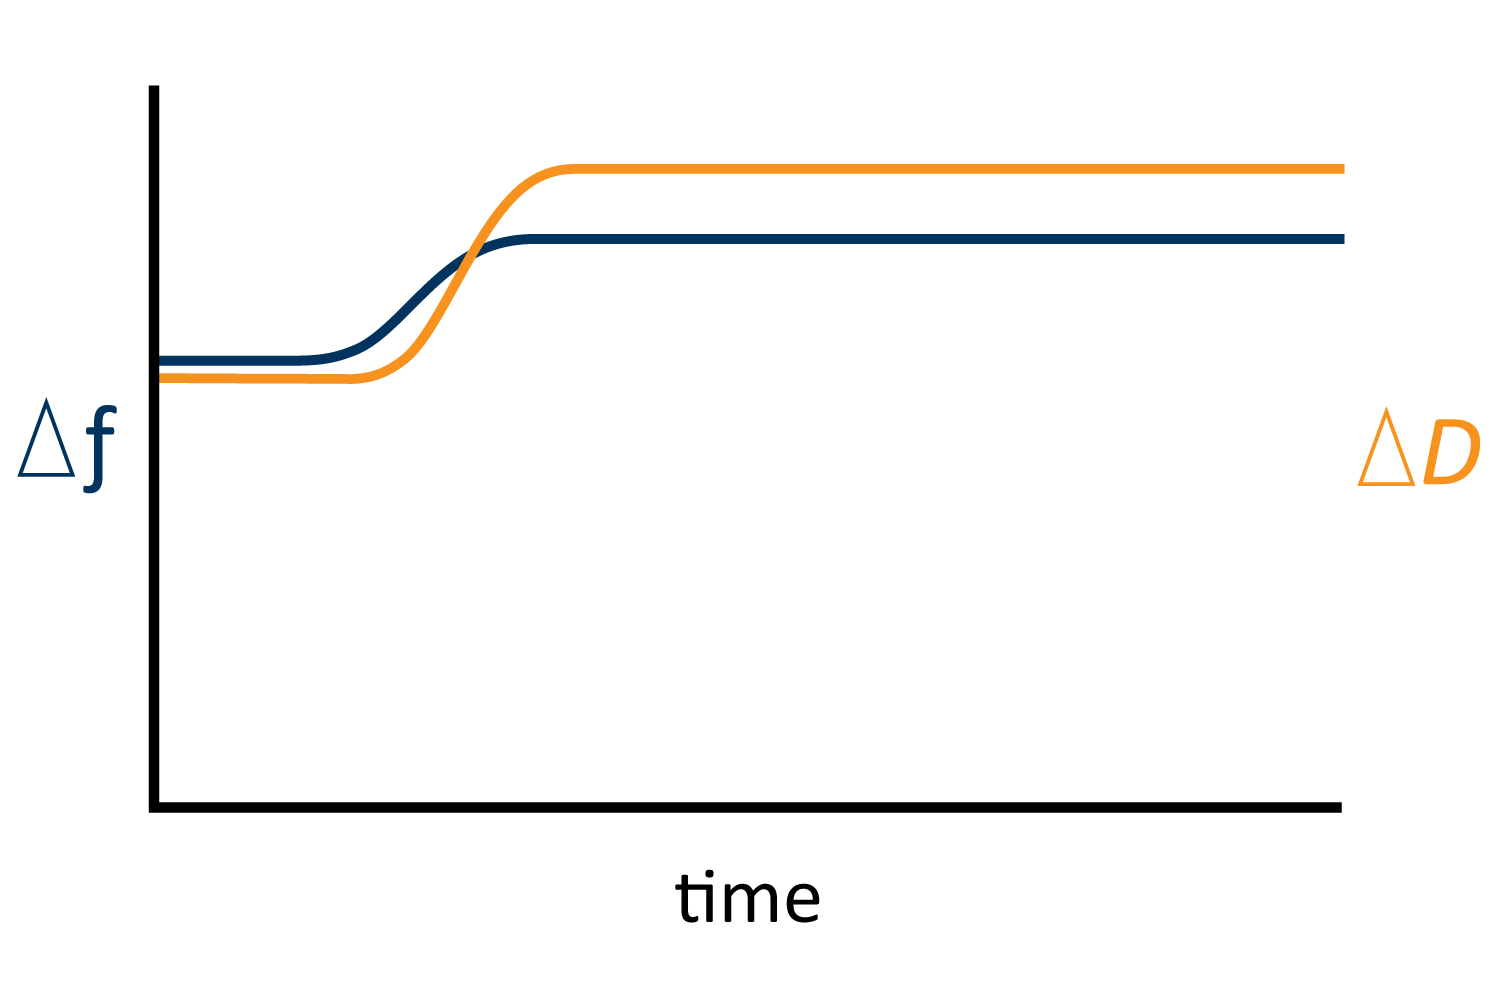
- Increase in Δf with Increase in ΔD: This indicates mass removal associated with softening of the layer. For example, Enzymatic hydrolysis of cellulose, removal of grease or cooking oil in detergent (Figure 8).
Conclusion
The interpretation of frequency changes in QCM-D measurements requires careful consideration of both the physical properties of the adsorbed layer and the context provided by dissipation measurements. Dissipation changes in QCM-D measurements provide valuable information about the viscoelastic properties of the adsorbed layers. By analyzing dissipation alongside frequency changes, researchers can gain a comprehensive understanding of the material’s mass, structure, and viscoelastic properties of thin films and adsorbed layers. This information is crucial for various scientific and industrial applications.
- A. D. Easley, T. Ma, et.al. A practical guide to quartz crystal microbalance with dissipation monitoring of thin polymer films. 2021. Journal of Polymer Science. https://doi.org/10.1002/pol.20210324 ↩︎
- I. Plikusiene, V. Maciulis V, et.al. Spectroscopic Ellipsometry and Quartz Crystal Microbalance with Dissipation for the Assessment of Polymer Layers and for the Application in Biosensing. Polymers (Basel). 2022 doi: 10.3390/polym14051056. ↩︎