Particle analysis involves measuring various characteristics of powders or particulates, including size, shape, and composition. A wide variety of industries rely on particle analysis for ensuring product functionality and safety including the production of automobiles, batteries, pharmaceuticals, and electronics.
Choosing the right particle analysis technique can be challenging due to the variety of available methods, each with its own strengths and limitations. Some techniques provide rapid results but lack detailed characterization, while others offer high-resolution imaging and elemental analysis but may require more time and expertise. The selection depends on factors such as the need for particle count, size distribution, shape analysis, and chemical composition.
In this article, we aim to briefly explain how each technique works and offer perspective on the most comprehensive solution for particle characterization.

Gravimetric Analysis
Gravimetric analysis is a coarse method that measures the total mass of collected particles by weighing them before and after filtration or deposition. This method is widely used for bulk particle analysis in environmental monitoring and industrial applications. However, it does not provide individual particle characteristics such as count, size, shape, or composition, making it unsuitable for detailed characterization.
Particle Counters
Particle counters detect and count particles suspended in air or liquid, often using light scattering (optical particle counters) or electrical sensing (Coulter counters). These devices offer rapid size distribution data but do not assess particle shape or composition.
Optical particle counters (OPCs) work by passing a sample (airborne or liquid) through a laser beam. As particles pass through, they scatter light, and the intensity of scattered light is used to determine particle size and count.
Coulter counters operate based on electrical sensing, where a sample is suspended in an electrolyte solution and drawn through a small aperture. As particles pass through, they cause changes in electrical resistance, which are measured to determine particle size and count.
Dynamic Light Scattering (DLS)
Dynamic Light Scattering (DLS) is an optical method used to determine the size distribution of small particles in suspension by analyzing fluctuations in scattered light intensity caused by their Brownian motion1. These fluctuations are used to calculate the hydrodynamic diameter of the particles, providing insights into their size distribution.
Optical Microscopy
Optical microscopy allows for direct visualization of particles using light-based magnification. A sample is placed on a slide and illuminated under a microscope, allowing visual assessment and manual or automated image analysis. This method provides useful data on count, size, and shape but lacks elemental composition analysis and is also limited in resolution when it comes to nanoscale particles.
Inductively Coupled Plasma Mass Spectrometry (ICP-MS)
ICP-MS is a highly sensitive technique for detecting trace elemental compositions in materials. The sample is ionized using an inductively coupled plasma, and the resulting ions are analyzed by a mass spectrometer to precisely determine elemental composition. Being a destructive technique, it does not provide information on particle count, size, or shape, making it useful for applications requiring elemental quantification but not morphological studies.
Scanning Electron Microscopy (SEM)
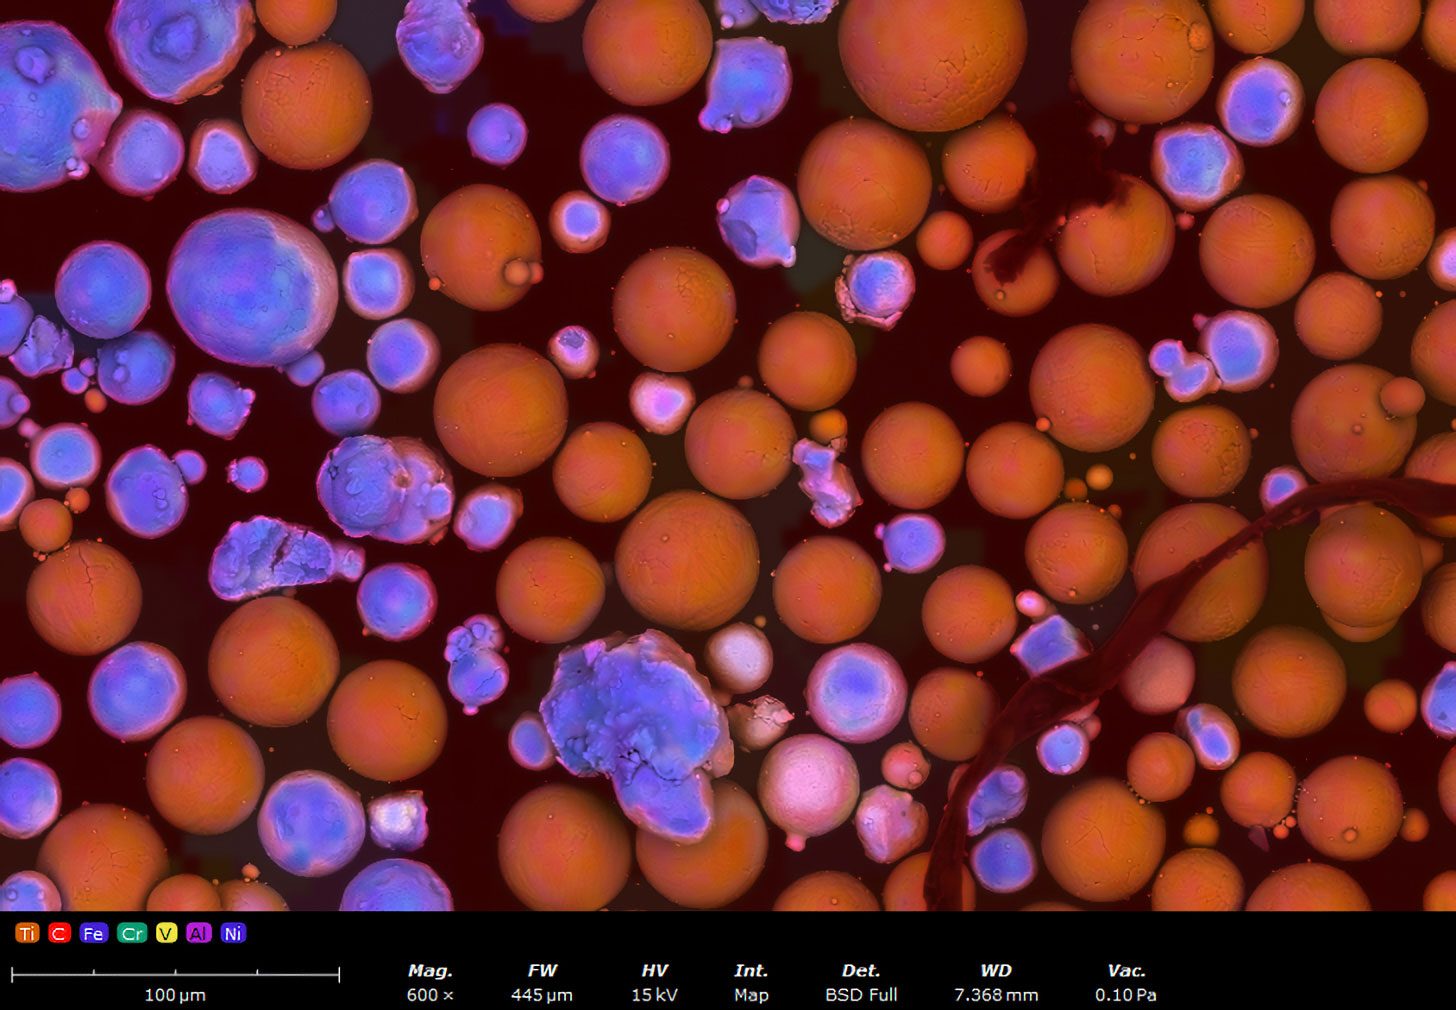
SEM is a high-resolution imaging technique that provides detailed information on particle morphology and elemental composition. A focused electron beam scans the sample, producing high-resolution images by detecting backscattered or secondary electrons emitted from the surface2. Notably, SEM surpasses the resolution limits of optical microscopy and can accurately detect particle sizes down to the nanoscale. With integrated energy-dispersive X-ray spectroscopy (EDS), SEM can also be used to detect the elemental composition of individual particles.
An example of an SEM image of metallic spherical particles is shown in Figure 1. The image is a composite of the SEM image, highlighting the morphology of the sample, and EDS map, which shows the distribution of elements within the particles.
Why SEM is the Best Choice
Among these techniques, SEM stands out as the most comprehensive for particle analysis (Table 1). Unlike gravimetric analysis, particle counters, or DLS, SEM provides detailed size and shape information of every individual particle detected. While ICP-MS is excellent for chemical detection, it is a destructive technique and does not provide individual particle composition or size and shape metrics. SEM also surpasses the resolution limits of optical microscopy, allowing for nanoscale particle analysis while simultaneously offering elemental composition insights.
| Method | Count | Size | Shape | Composition | |
| Gravimetric | No, only total mass | ||||
| Particle counters | |||||
| DLS | |||||
| Optical Microscopy | |||||
| ICP-MS | |||||
| SEM | |||||
References
- F. Babick, “Dynamic light scattering (DLS),” in Characterization of nanoparticles, Elsevier, 2020, pp. 137-172. https://doi.org/10.1016/b978-0-12-814182-3.00010-9 ↩︎
- W. Zhou, R. Apkarian, Z. L. Wang and D. Joy, “Fundamentals of Scanning Electron Microscopy (SEM),” in Scanning Microscopy for Nanotechnology, Springer, 2007, pp. 1-40. https://doi.org/10.1007/978-0-387-39620-0_1 ↩︎