Scanning electron microscopy (SEM) has long been a cornerstone in material science, biology, and engineering for its ability to provide high-resolution images of a sample’s surface. The technique involves rastering a focused electron beam across the sample surface and detecting the various signals generated by beam-sample interactions to produce two-dimensional (2D) images. Beyond conventional imaging, it is possible to extract three-dimensional (3D) information from SEM images. This advanced approach allows researchers to explore the topography of a sample in three dimensions, revealing features that are often hidden in standard imaging. In this blog, we’ll explore the principles behind 3D surface visualization using SEM and how it enhances our understanding of complex surface structures.

Is SEM Data 3-D?
Although a SEM image may sometimes seem 3D, it is actually a 2D dataset. The word “scanning” in SEM refers to the movement of the electron beam over the sample. SEMs use a raster strategy to form images. This means that the focused electron beam (“probe”) is rapidly scanned from left to right across rows of the imaged area. At each position, the electron beam briefly stops, or dwells, while various signals are collected by different detectors. This means that the image is formed pixel by pixel as illustrated in Figure 1. For example, Phenom Desktop SEMs use a dwell time of 200 nanoseconds, thanks to the high-brightness CeB6 electron source, allowing images to be acquired in a matter of seconds.

Two common signals that can be used to form SEM images are backscattered electrons (BSE) and secondary electrons (SE). BSE images convey compositional contrast whereas SE images exhibit topographic contrast. Different detectors are used for each type of signal. BSE detectors are typically located directly above the sample and are configured in an annular shape, with the beam passing through an opening in the center. SE detectors are located adjacent to and above the sample surface, meaning they essentially view the sample from an angle.
How is 3-D Information Obtained From SEM Images?
While the raw data from an SEM is 2D, 3D information can be inferred or reconstructed using different methods, such as:
Tilt Series Imaging (Tomography):
The sample is imaged at different tilt angles, typically by rotating it within the SEM chamber.1,2 By capturing images from various perspectives, the software can reconstruct a 3D model of the surface. Capturing and processing a tilt series is more complex and time-consuming than standard SEM imaging. It requires careful alignment, multiple image acquisitions, and extensive computational processing for 3D reconstruction.
Focus Variation:
Like optical microscopy methods, the SEM takes a series of images of the sample while varying the focal plane (working distance) for each image.3 This means the focus is adjusted slightly for each successive image, capturing different parts of the sample’s surface in sharp detail at each step. By identifying which parts of the sample are in focus at different focal planes, the SEM can map the relative heights of various surface features. This creates a depth map that represents the topography of the sample. While this approach is less complex than tomography, it still requires that multiple images be taken making it a time-consuming process.
FIB-SEM:
Combines focused ion beam (FIB) milling with SEM to remove thin layers of a sample in situ, allowing for sequential imaging of the exposed surface after each milling step.4 These images are then compiled using an algorithm to create a detailed 3D reconstruction of the sample. The method offers excellent depth resolution and is widely used in high-precision fields such as semiconductor manufacturing as well as biological and materials science research. However, its limitations include being destructive to the sample and expensive due to the need for specialized equipment.
Topographic Mapping:
As the electron beam scans across the surface of the sample, SEs and BSEs are emitted from the surface at different relative angles and heights. In samples with topographic features, the signal intensity will change based on the surface conditions with respect to the detector position. Areas of the sample that are tilted towards the detector tend to produce a stronger signal and appear brighter in the image, while areas that are tilted away appear darker. Advanced software can process the signals to construct a 3D model, providing a visual and quantitative representation of the sample’s surface. Topographic mapping is the fastest approach because it does not require the acquisition of multiple images, focus variation, or sample tilting to complete. A 3D map can be generated in the same time it takes to capture an SEM image.
Segmented BSE Detector for Rapid Topographic Mapping on Phenom Desktop SEMs
All Phenom Desktop SEMs come standard with the ability to generate 3-D surface visualizations thanks to employing a segmented BSE detector (BSD). Phenom’s BSD is composed of four solid-state sensor quadrants and is located directly above the sample with the beam passing through an opening at the center. This unique design allows for the BSE signal to be maximized while also providing flexibility for quantitative and qualitative topographic imaging.
On a flat surface, the electrons emitted from the sample evenly light up all parts of the detector. But when a sample has varied topography, some areas of the detector pick up more signal than others (Figure 2). This distinct feature gives Phenom Desktop SEMs the ability to offer two specialized options for topographic mapping:

1. 3D Roughness Reconstruction (Quantitative)
The 3D Roughness Reconstruction software application allows any Phenom Desktop SEM to generate 3D images and sub-micrometer roughness measurements. Using a “shape from shading” algorithm,5 four images are captured simultaneously (one from each BSD quadrant) and used to create a 3D map of the surface (Figure 3).
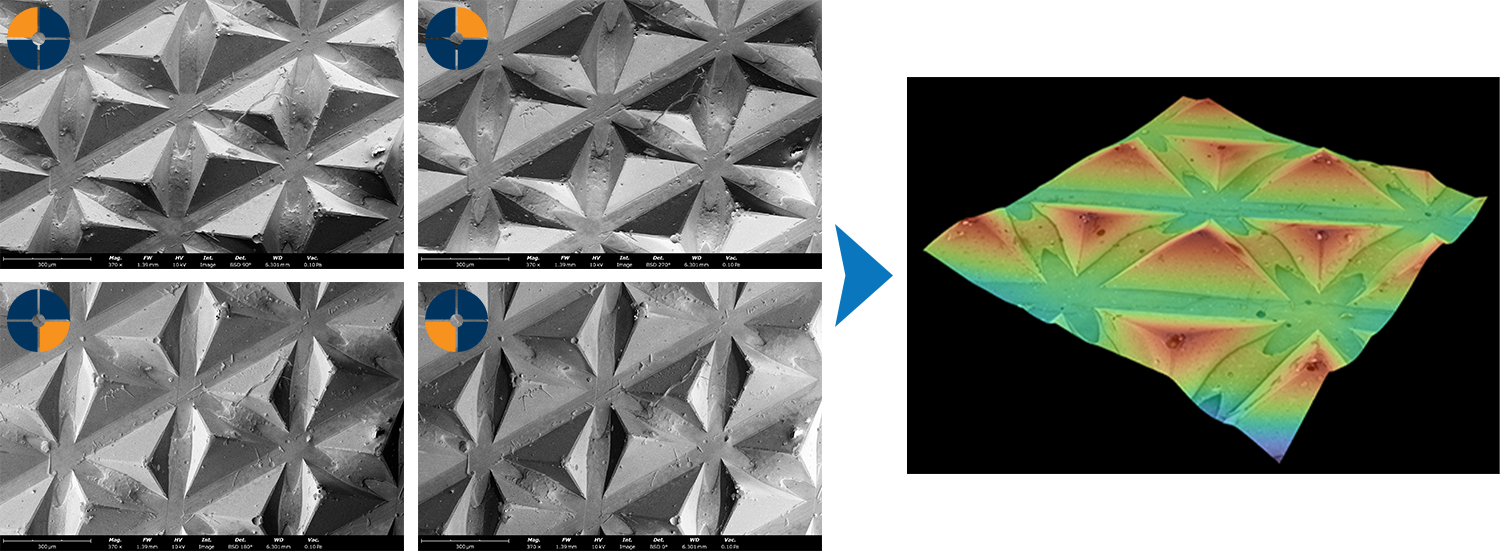
In the software, users can choose from several display modes, including 3D, 2D (top-down), and the option to turn the heat map on or off. The heat map uses colors to represent surface height, making it easier to interpret the topography compared to the usual grayscale images. Roughness measurements can be tailored by adjusting filters to show the desired depth resolution, ensuring that the measurements accurately reflect the features of interest, like the surface pyramids found across the sample imaged in Figure 3 or the textural differences across the faces of the pillars.
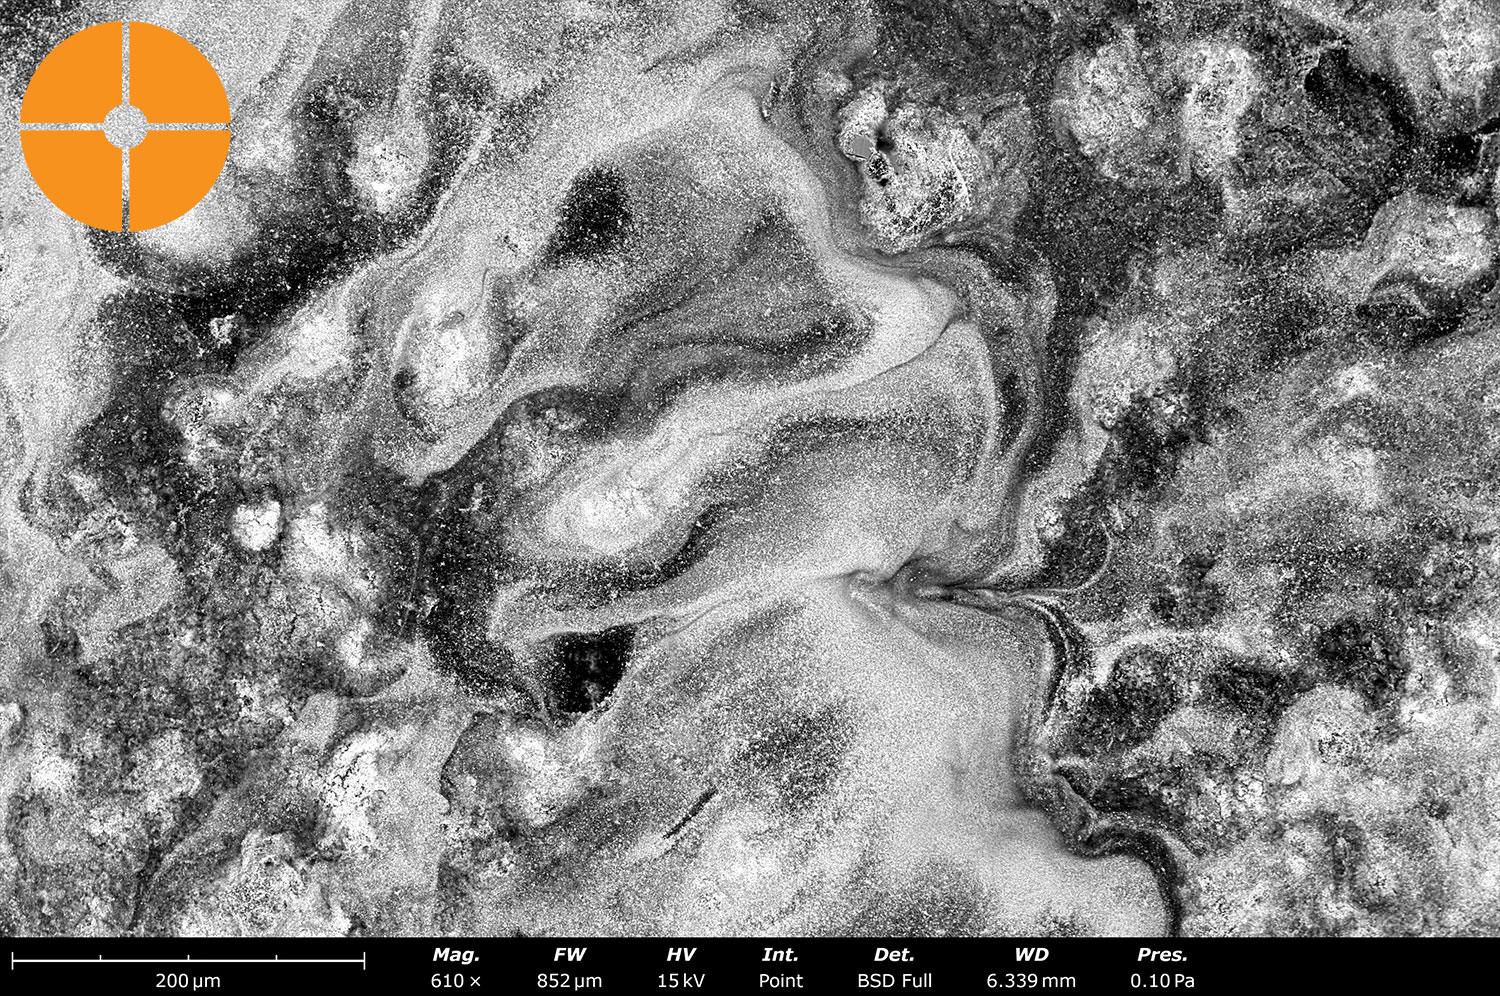
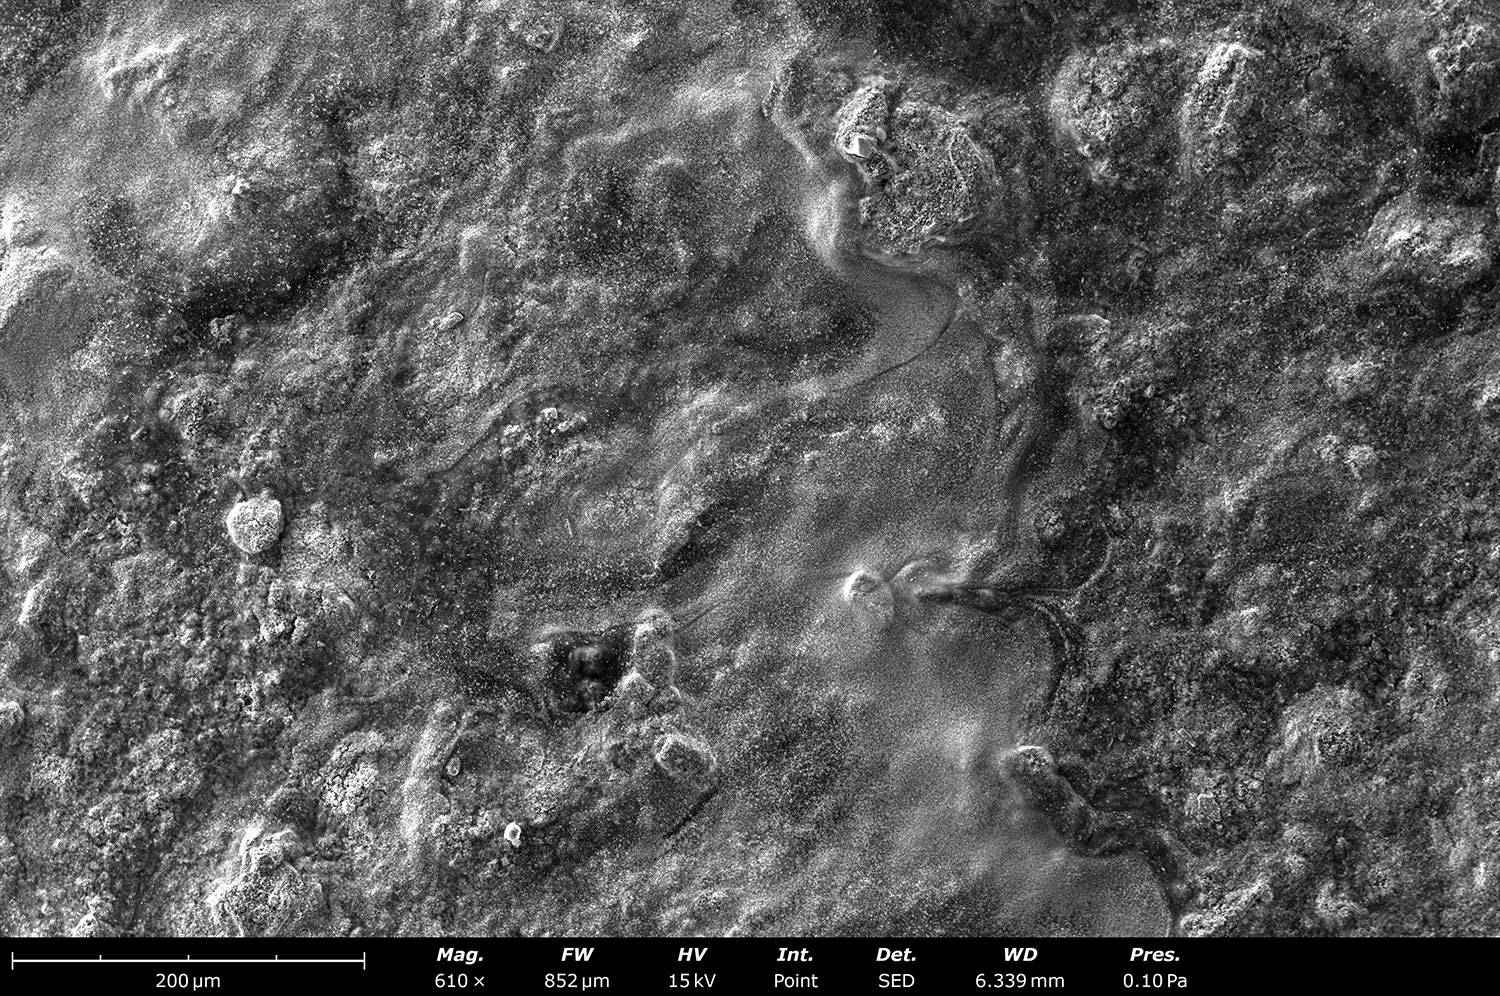
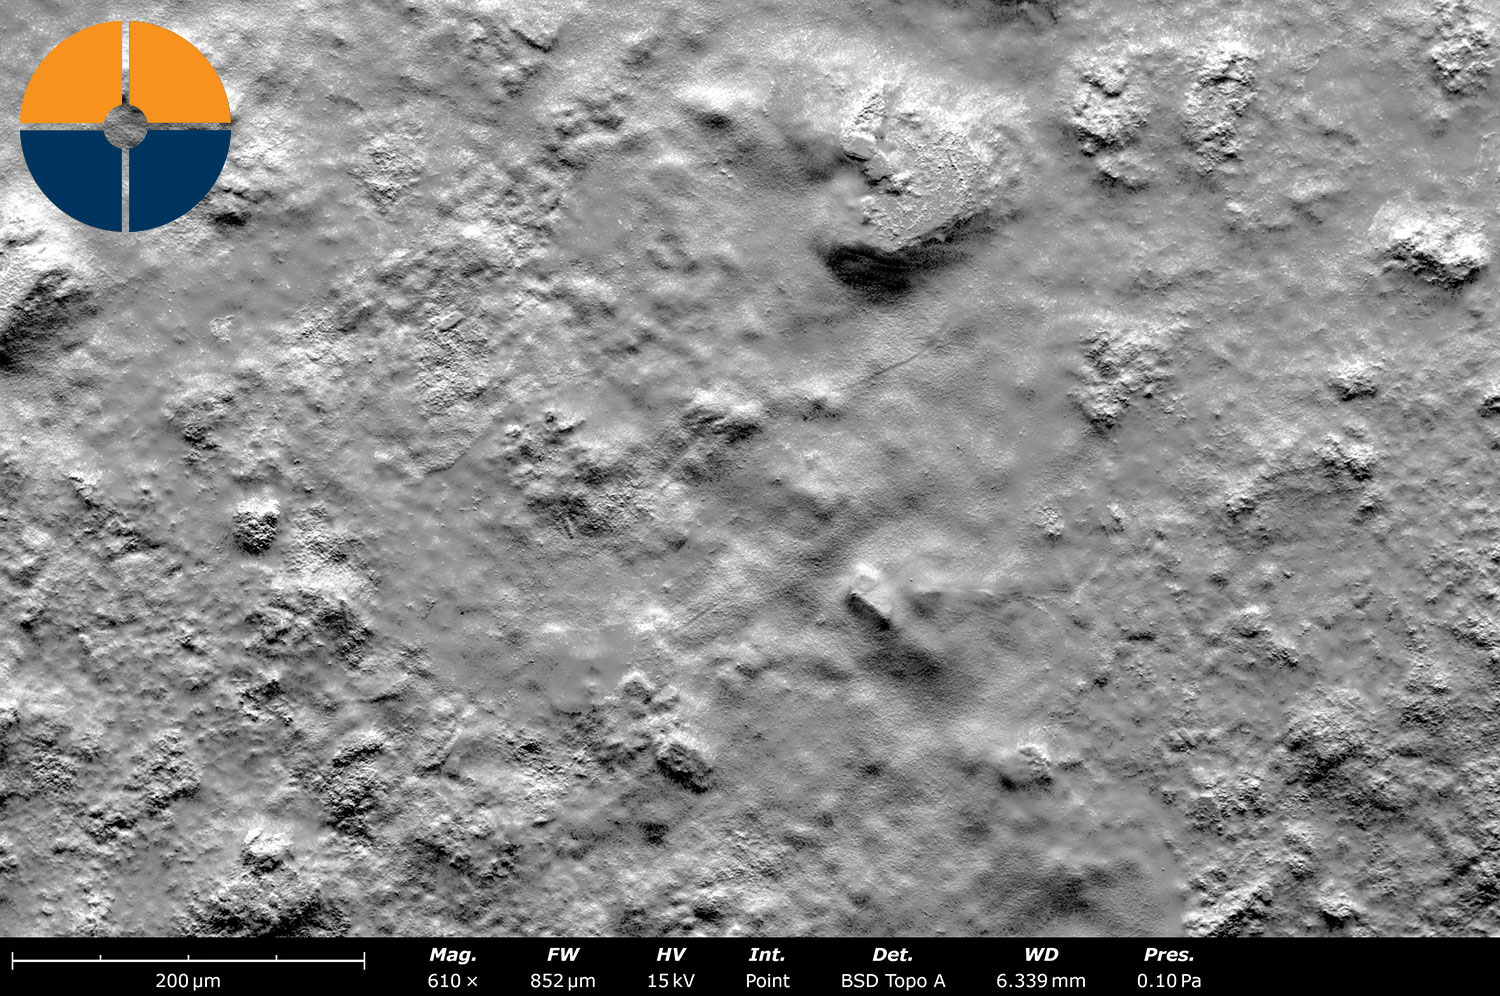
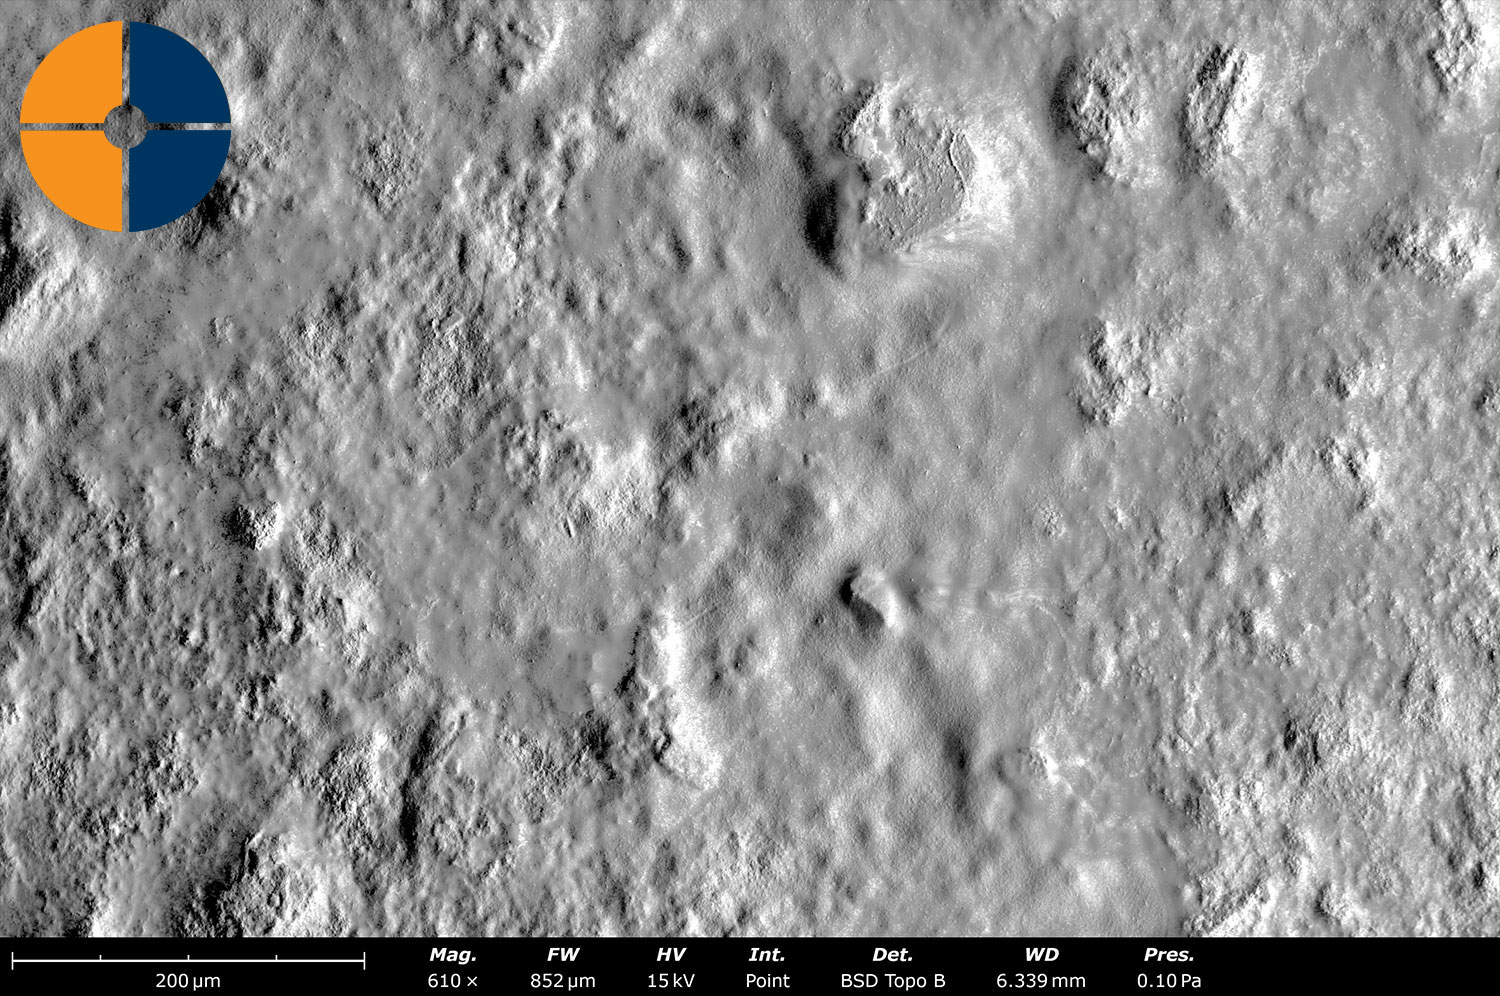
2. Topographic Imaging Mode (Qualitative)
All Phenom Desktop SEM models also have the option for topographic imaging mode, which provides a qualitative 2D visualization of surface topography. Enabled by the segmented BSD, these imaging modes (Topo A and Topo B) are created by subtracting signals from the top/bottom or left/right halves of the BSD. The topographic imaging mode can be used to highlight topographic details that may be hard to see in a standard BSE image, and also provide complementary information to the SE images (Figure 4).
Key Takeaways
While SEM images are 2D, 3D information can be obtained through specialized techniques like tilt series imaging, focus variation, and topographic mapping. These methods allow for the reconstruction of a sample’s surface in three dimensions, providing deeper insights into its structure and features. Of the three approaches, topographic mapping is the fastest and simplest because it only requires one image to be taken to generate a full 3D dataset. All Phenom Desktop SEMs are equipped with a segmented BSD, enabling both quantitative and qualitative topographic mapping.
References
- S. LÜCK, M. SAILER, V. SCHMIDT and P. WALTHER, “Three-dimensional analysis of intermediate filament networks using SEM tomography,” Journal of Microscopy, vol. 239, no. 1, pp. 1-16, 2010. ↩︎
- E. Ponz, J. L. Ladaga and R. D. Bonetto, “Measuring Surface Topography with Scanning Electron Microscopy. I. EZEImage: A Program to Obtain 3D Surface Data,” Microscopy and Microanalysis, vol. 12, no. 2, pp. 170-177, 2005. ↩︎
- F. Helmli, “Focus Variation Instruments,” in Optical Measurement of Surface Topography , Springer, 2011, pp. 131-166. ↩︎
- C. Kizilyaprak, A. G. Bittermann, J. Daraspe and B. M. Humbel, “FIB-SEM Tomography in Biology,” in Electron Microscopy Methods and Protocols, Humana Press, 2013, pp. 541-558. ↩︎
- J. Hejna and L. Reimer, “Backscattered electron multidetector systems for improved quantitative topographic contrast,” The Journal of Scanning Microscopies, vol. 9, pp. 162-172, 1987. ↩︎