Live Elemental Mapping
ChemiSEM & ChemiPHASE
ChemiSEM and ChemiPhase software options enhances the energy dispersive X-ray Spectroscopy (EDS) capabilities of the Phenom Desktop SEM by leveraging powerful machine learning tools.
Instant Elemental Mapping
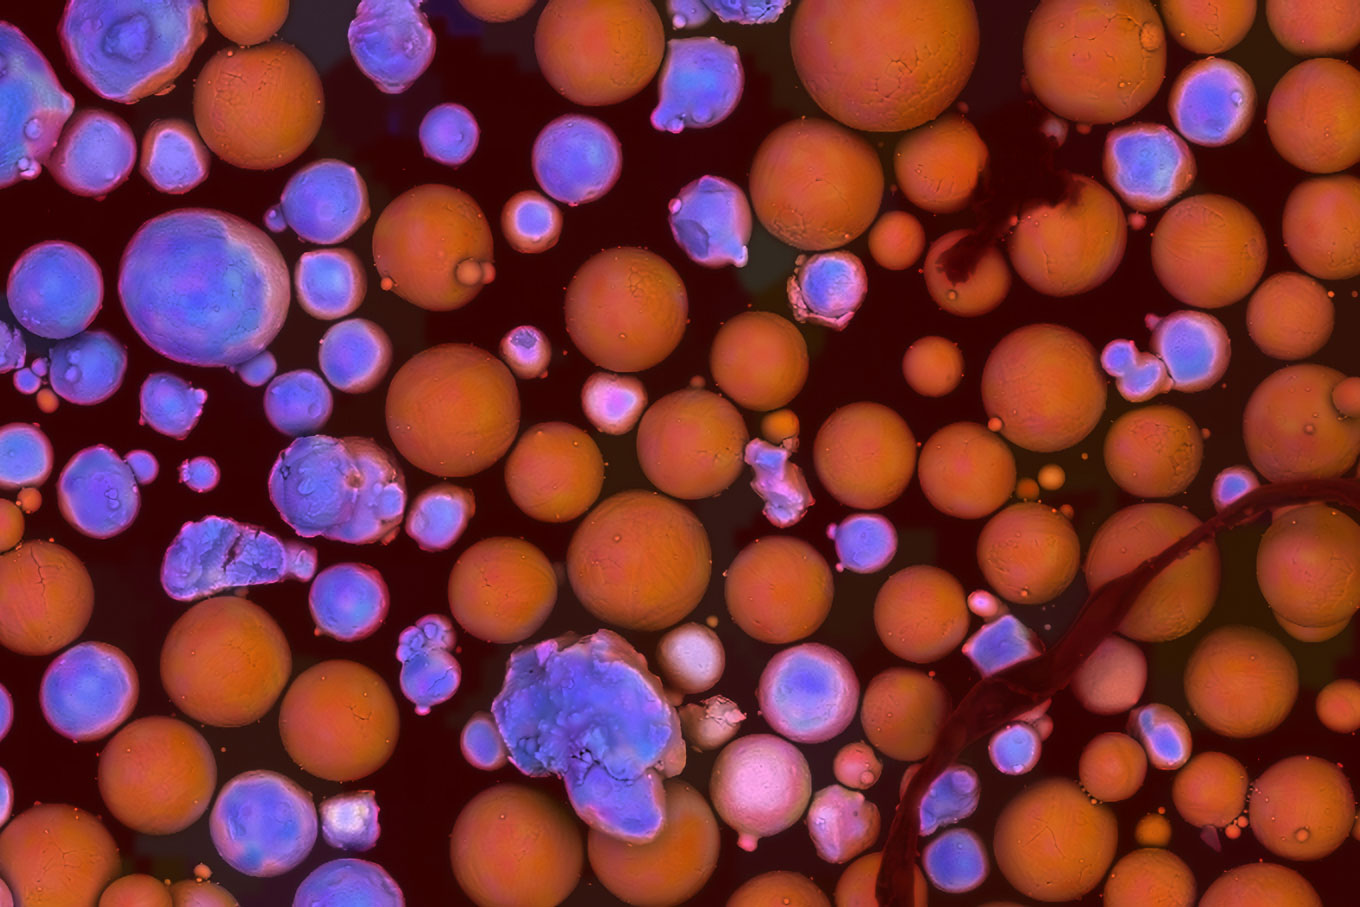
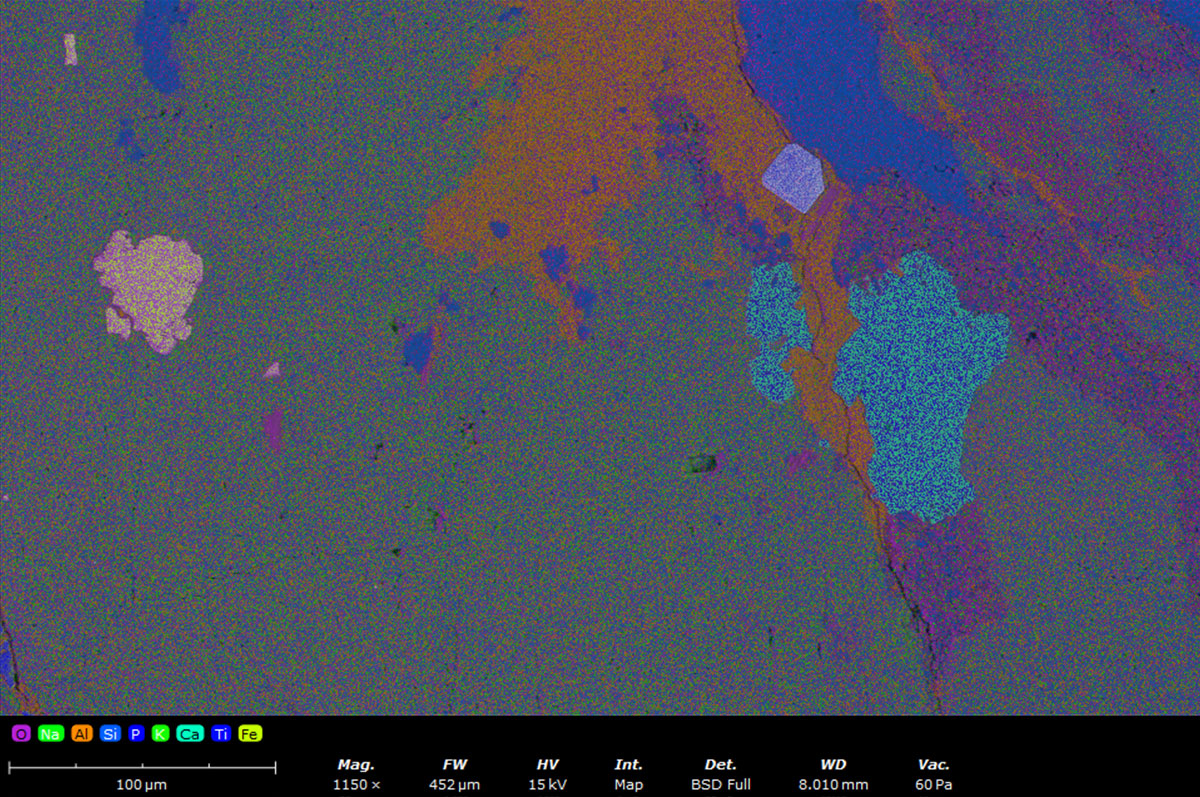
See elemental distribution live as you image with real-time, color-coded overlays.
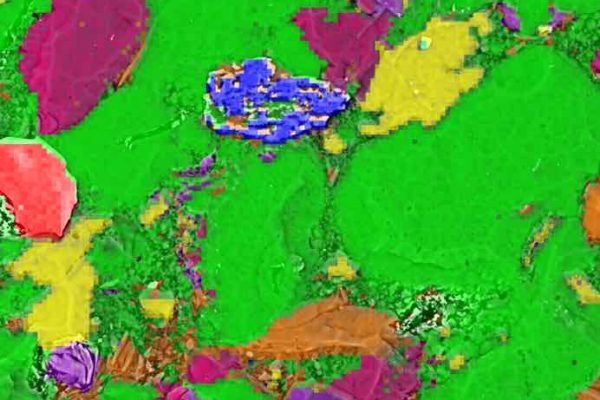
Precise Phase Identification
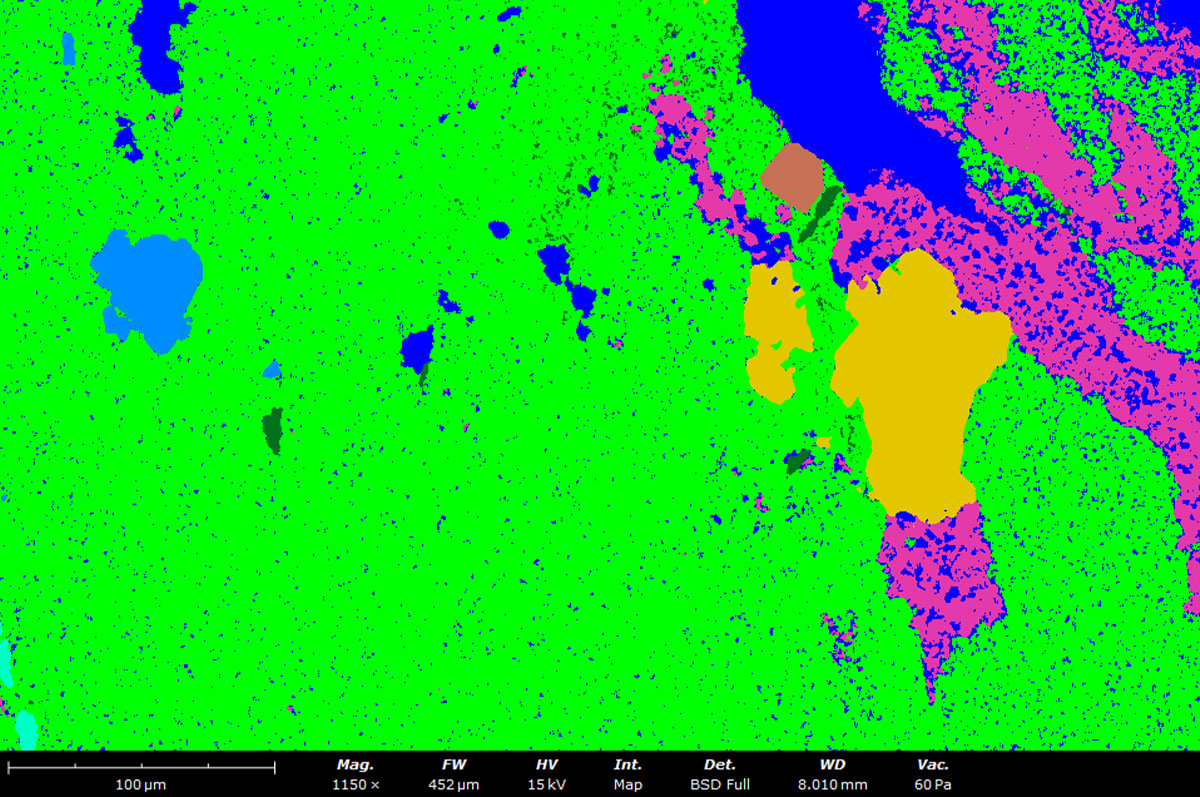
Phase mapping with pixel-level precision provides clear, color-coded identification of compositionally distinct phases.
Smart Spectral Fitting
Advanced algorithms handle peak overlaps, background removal, and artifacts to ensure your results are always accurate.
Talk to an Instrumentation Specialist Today!
simplify EDS workflows quickly & easily with Live mapping
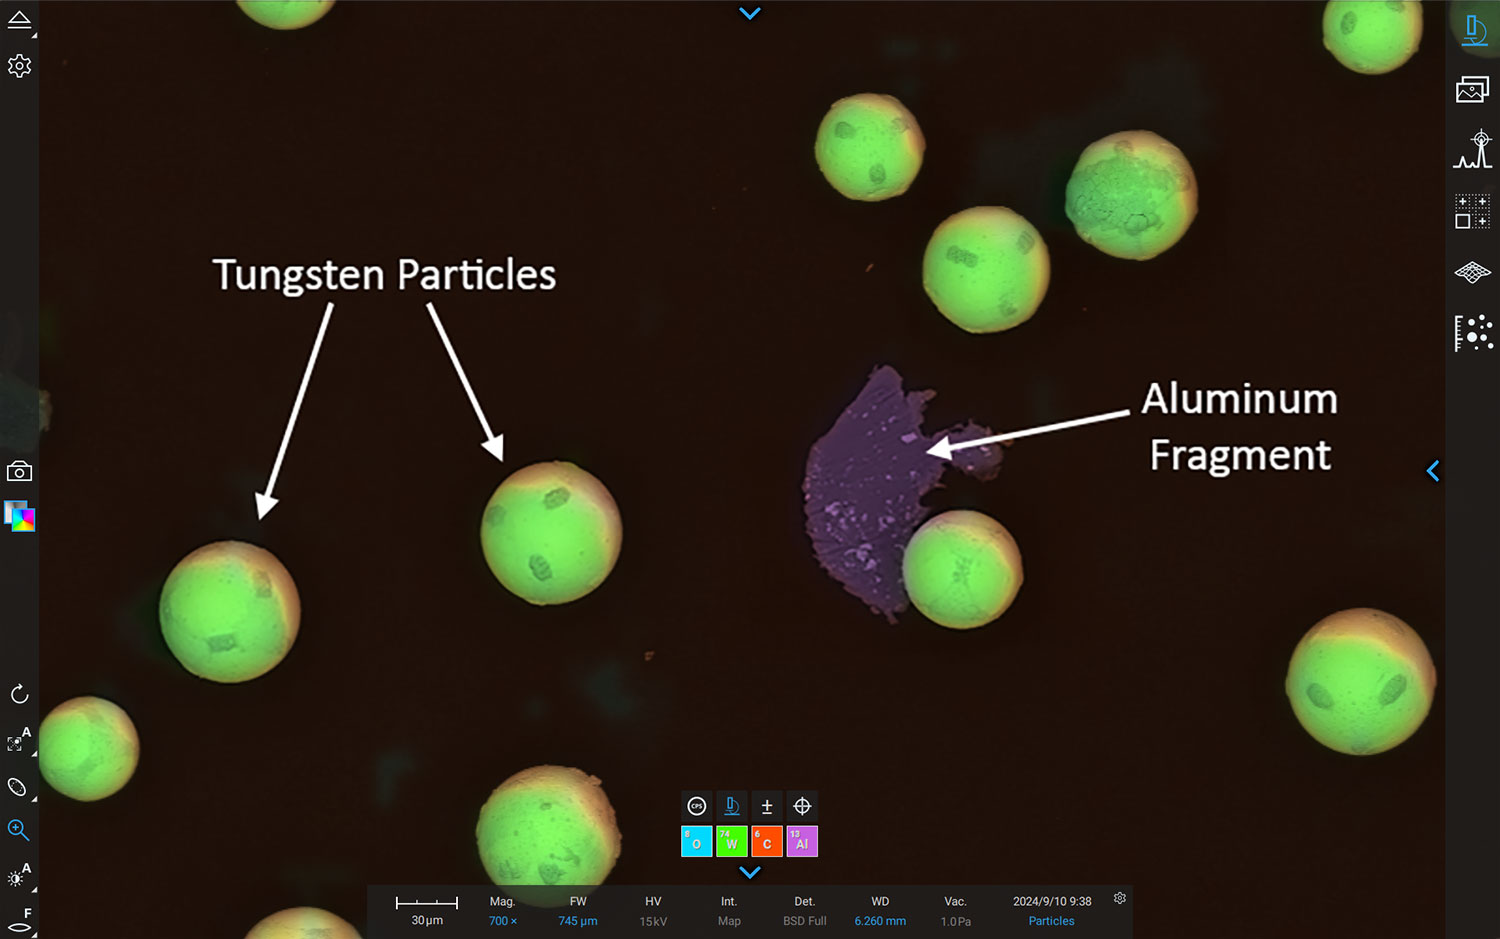
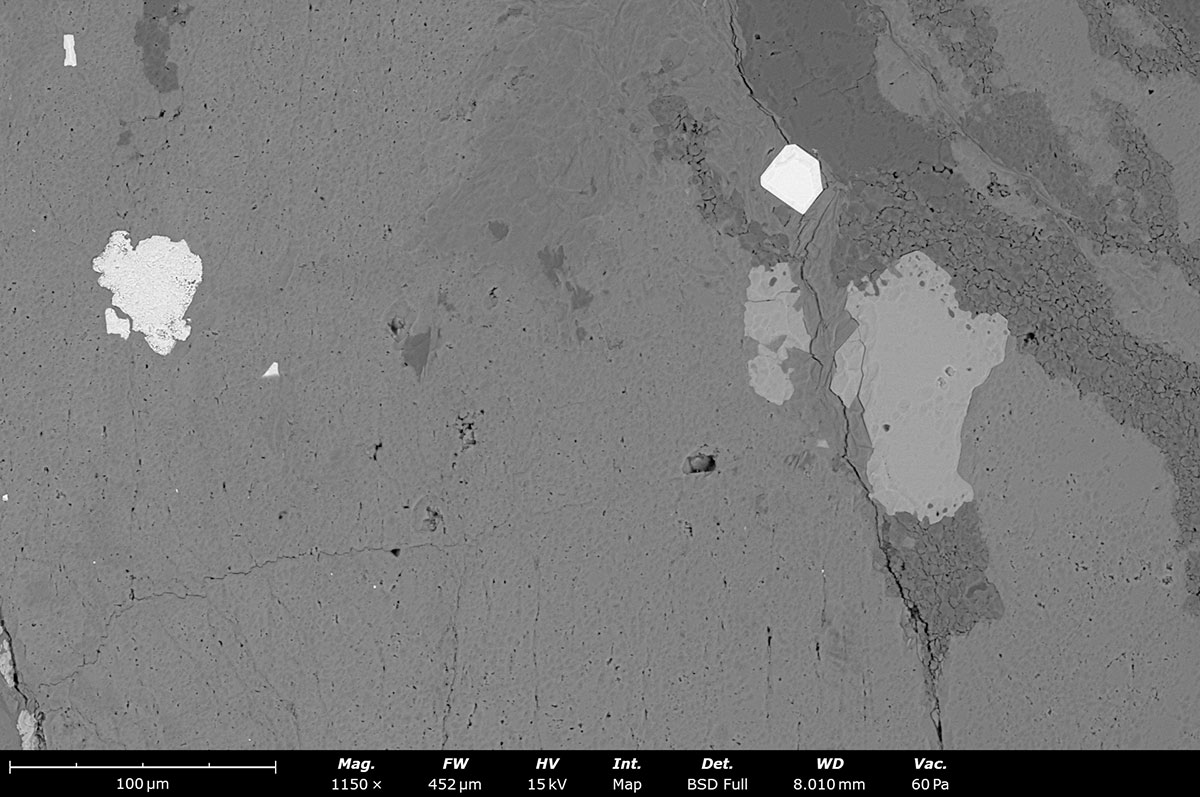
With ChemiSEM, the live imaging mode allows you to visualize both the sample morphology and elemental distribution simultaneously. ChemiSEM combines machine learning and ultrafast signal processing to display real-time elemental maps over live SEM images. This integration enhances the data acquisition experience by making it easier to identify areas of interest, detect contaminants, and understand the elemental make-up of samples.
ChemiPhase is an advanced analysis tool that goes beyond standard EDS mapping. While EDS shows where individual elements are located, ChemiPhase groups areas with similar elemental compositions to identify distinct phases in a sample. This approach provides a clearer view of your sample’s microstructure, highlighting regions with similar elemental percentages and offering deeper insights into the material’s properties and behavior.
Live EDS Mapping Software
Product Features - Chemisem
Real-time imaging and elemental analysis
ChemiSEM is an advanced technology that combines Scanning Electron Microscopy (SEM) with Energy Dispersive Spectroscopy (EDS). What sets ChemiSEM apart is its ability to seamlessly integrate imaging and elemental analysis, giving you a comprehensive view of your sample’s composition in real time. This ensures that you have the most detailed and accurate information right at your fingertips, without the need for time-consuming, separate analyses
Integrated into Phenom UI
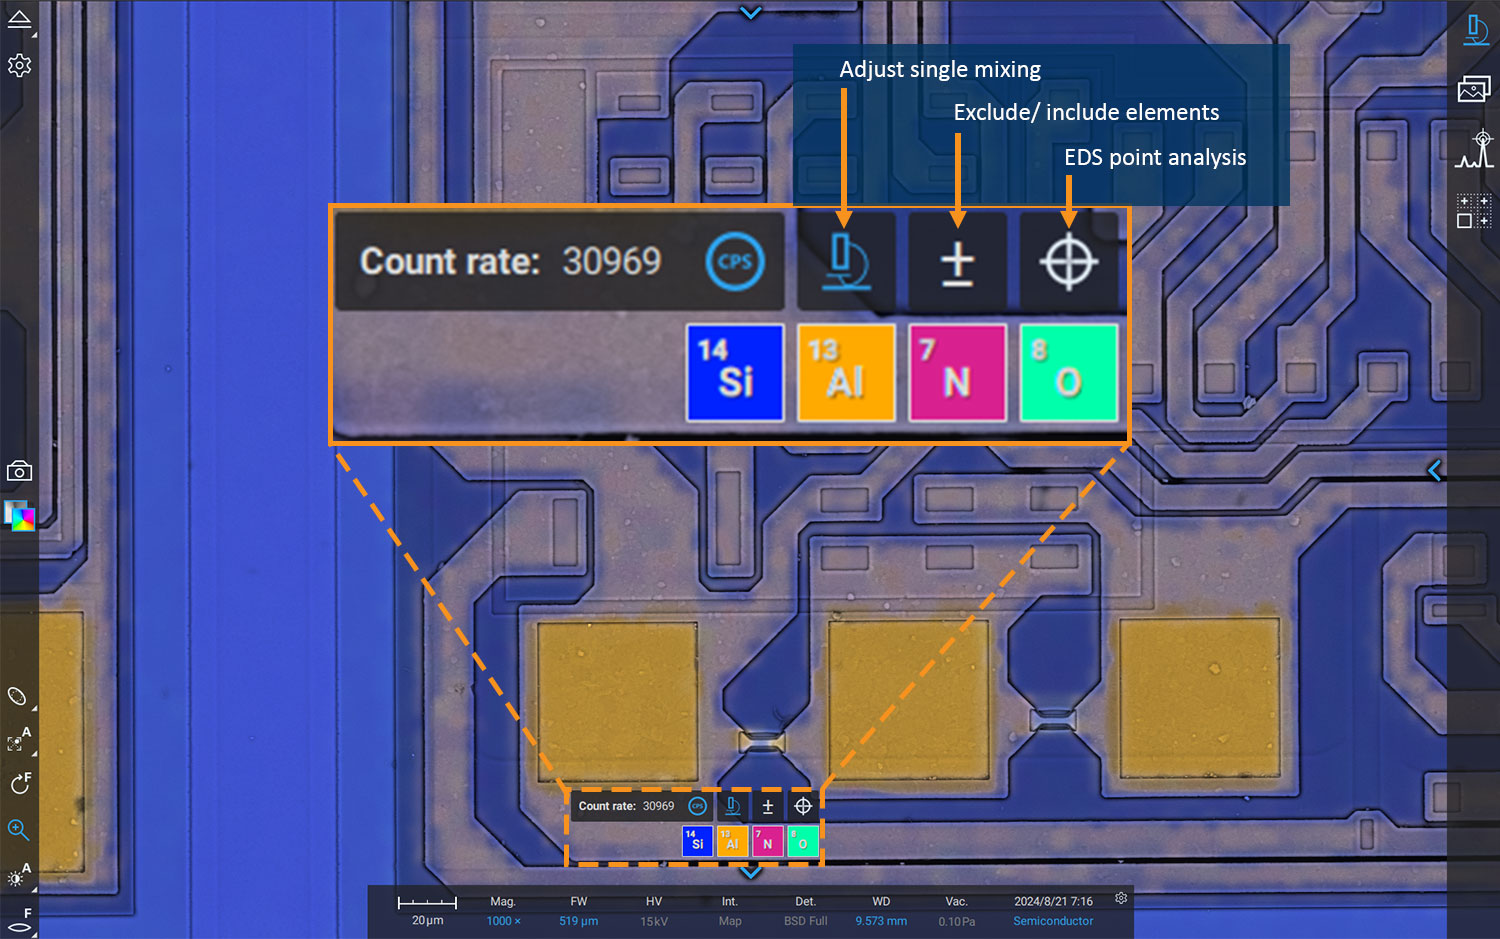
ChemiSEM can be activated with a single click. The control panel provides a real-time readout of the x-ray count rate and displays automatically identified elements as color-coded icons corresponding to the ChemiSEM image shading. Users can adjust the intensity of the color overlay relative to the SEM image, making either the SEM image or the ChemiSEM color image fully visible. Additional features include a periodic table for selecting or excluding elements and a crosshair tool for point analysis, which shows elemental abundance data (in weight %) at any selected location.
Accelerated decision making
SEM-EDS can provide a straightforward non-destructive analysis, making it a powerful tool for quality control, research, and materials development across various industries. ChemiSEM’s integration of SEM imaging with instantaneous elemental analysis streamlines the data collection process, saving time and allowing for on-the-fly decision making.
ChemiPHASE
Product Features - ChemiPhase
Detailed phase mapping
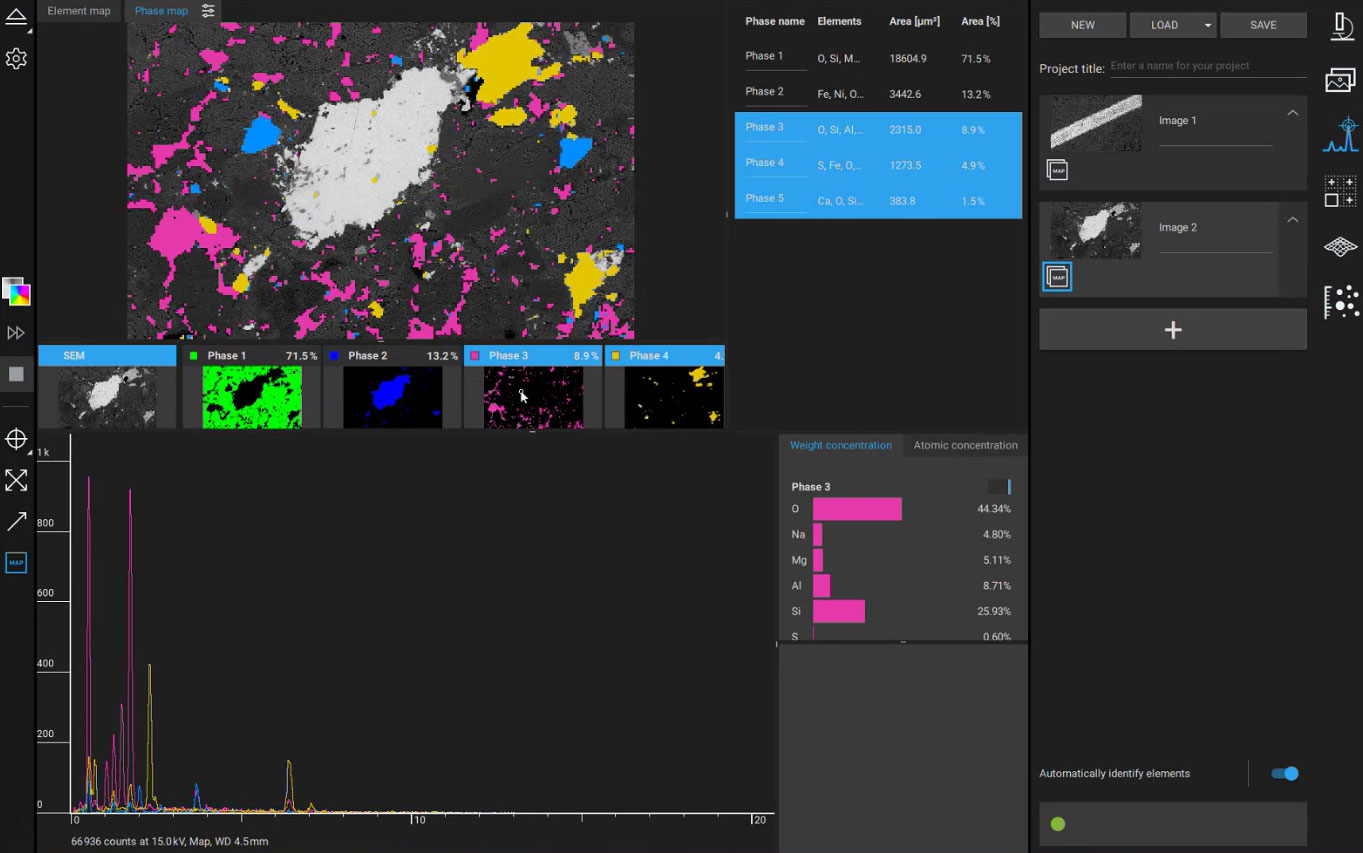
Analyzing complex, multiphase materials with SEM and EDS often presents challenges due to overlapping spectral signals, which can complicate data interpretation. Traditional EDS mapping frequently produces convoluted color displays that obscure the underlying microstructure. ChemiPhase streamlines this process by performing pixel-by-pixel analysis of EDS maps, generating precise phase maps that clearly differentiate regions with similar elemental compositions, enabling more accurate and meaningful insights.
Customizable number of phases
The ChemiPhase algorithm relies on principal component analysis (PCA) to simplify EDS maps and highlight hidden microstructural details. The user can choose the initial number of phases and has the freedom to add and remove phases to help arrive at the best interpretation. Within the software, you can view the EDS spectral fingerprint of each phase to better understand how the data is being processed.
Deeper material insights
ChemiPhase simplifies the analysis of complex materials by automatically identifying and mapping regions with similar elemental compositions. This process gives you a clear picture of the different phases within your sample, allowing you to understand the material’s properties more thoroughly.
ChemiSEM & ChemiPhase
Product Knowledgebase
Webinar
Elemental analysis is a crucial aspect of material characterization, but traditional metho…

Blog
5 Benefits of Scanning Electron Microscopy for Particle Analysis
Particle analysis is a critical process in many industries, from pharmaceutical formulatio…
White Paper
Electron Microscopy of Minerals
Scanning Electron Microscope Additional Signals Scanning electron microscopy is now a rout…