Phenom DESKTOP SEM
Energy Dispersive X-Ray Spectroscopy (EDS)
Energy dispersive X-ray spectroscopy or Energy dispersive spectroscopy (EDS or EDX) provides elemental composition information by analyzing the X-rays released by a sample when hit by the electron beam. This is a fast, accurate and non-destructive method for identifying elements on a micron-scale.
Fast Results
High X-ray count rates provide results quickly, even over large areas
One-Click Analysis
Fully integrated workflow ensures that collecting and interpretating data is fast and accurate
Real-Time Elemental Mapping
ChemiSEM provides real-time elemental maps over live SEM images, providing instant visualization of sample morphology and composition
Talk to an Instrumentation Specialist Today!
Seamless Integration with Fast Results
The advanced CeB6 and FEG sources deliver high X-ray count rates, significantly reducing analysis time compared to traditional tungsten-based systems. With a fully integrated silicon drift detector (SDD) featuring an ultra-thin window, elements from B to Cf can be detected effortlessly—even across large areas—in under 60 seconds.
Seamlessly integrated hardware and software make elemental analysis on the Phenom intuitive and efficient. The user interface enables smooth transitions between image collection and EDS acquisition, while a finely tuned peak identification algorithm ensures accurate elemental data, regardless of the user’s expertise. Detector settings automatically adapt to beam conditions, guaranteeing optimal results every time.
EDS Detector
Product Features
Intuitive Analysis Software
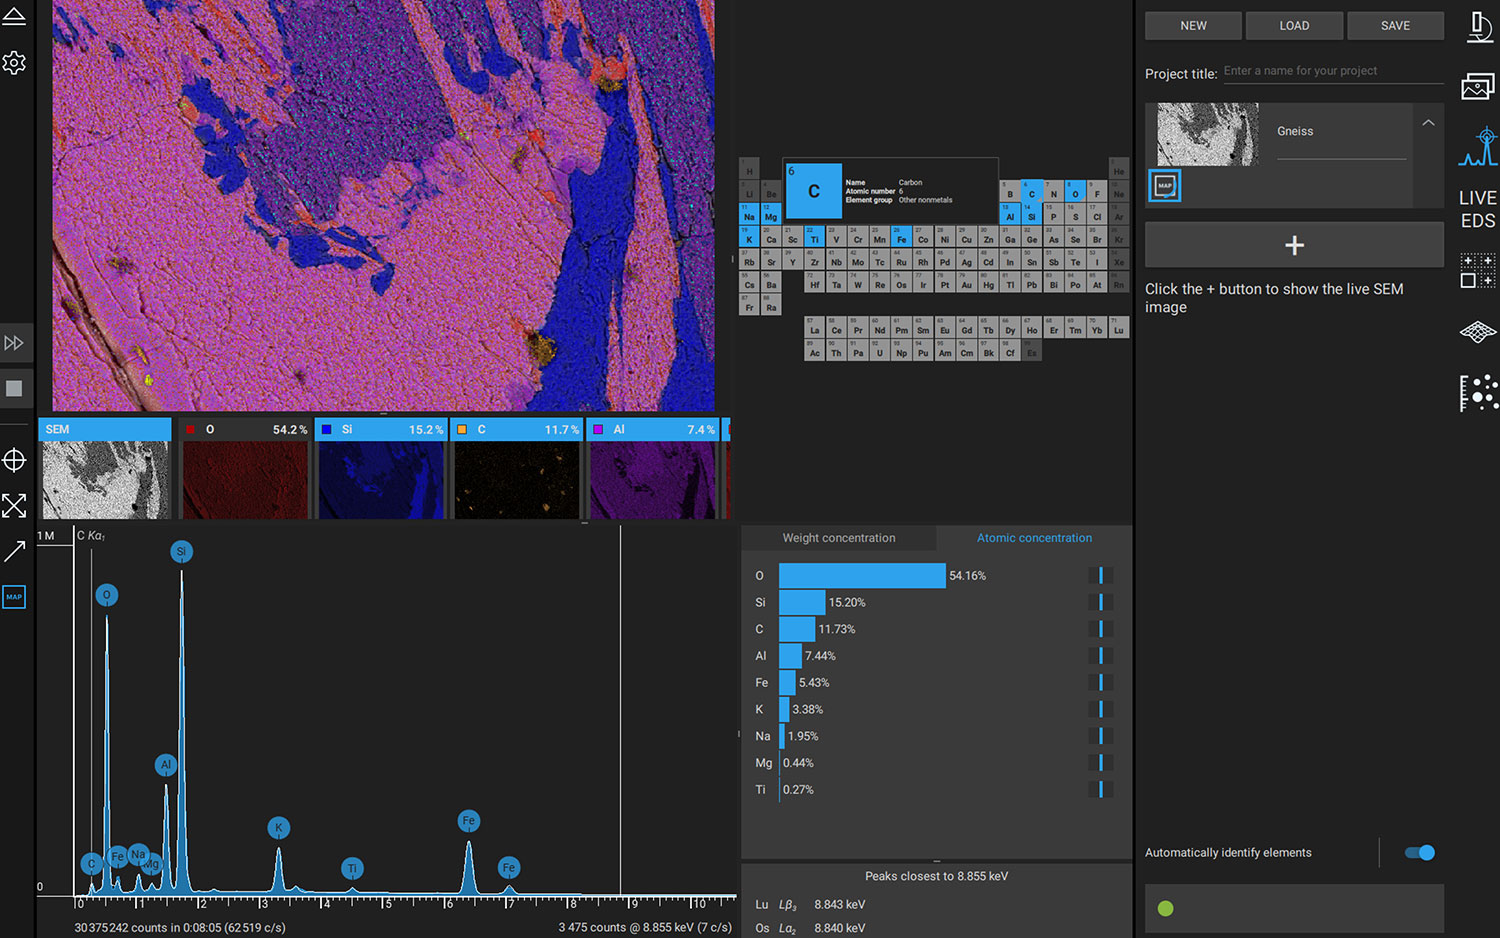
The dedicated Elemental Identification (EID) software controls the fully integrated EDS detector and facilitates step-by-step data collection and analysis within the Phenom UI. With EID, you can identify nearly all elements from Boron (5) to Californium (98). It uses smart algorithms for automatic peak identification, deconvolution of overlapping peaks, background and artifact correction, and drift correction (for mapping) with options for manual adjustments.
Four Powerful Analysis Modes
Discover the versatility of the Energy Dispersive X-ray Analysis software with four powerful analysis modes designed to meet diverse material characterization needs:
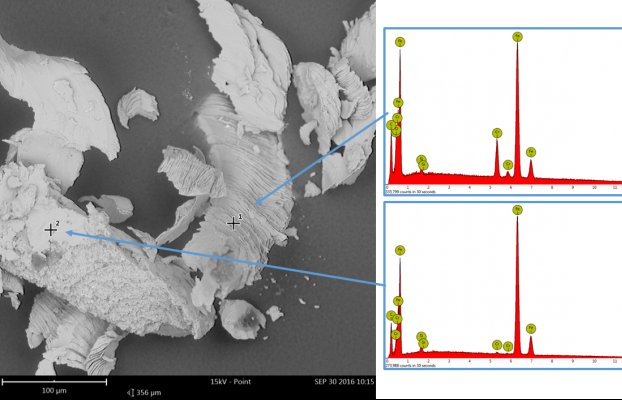
- Spot – quickly identify the elemental composition in a specific spot
- Region – Determine the average elemental composition of a selected area
- Line – Plot changes in elemental abundances along a line
- Map – Visualize spatial distribution of elements present in a sample
ChemiSEM
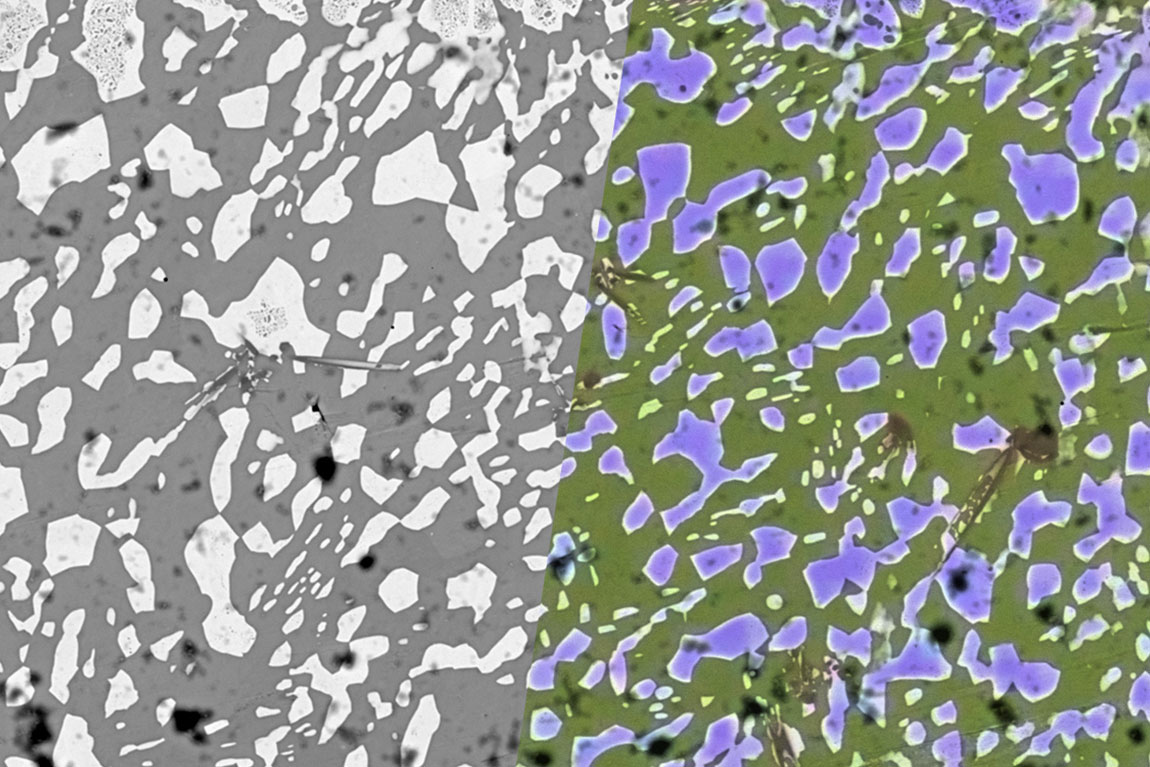
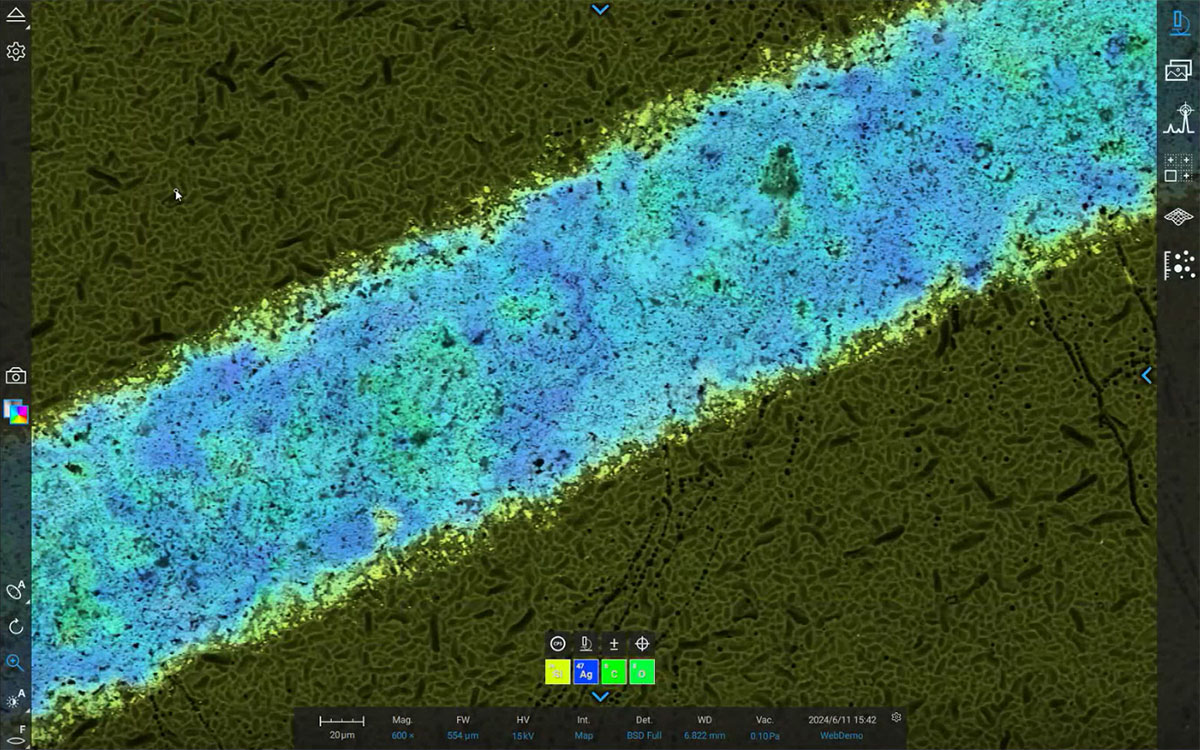
ChemiSEM is a software capability that combines machine learning and ultrafast signal processing to display real-time elemental maps over live SEM images. This integration enhances the data acquisition experience by providing instant visualization of sample morphology and composition, making it easier to identify areas of interest, detect contaminants, and understand elemental distribution within samples.
ChemiPhase
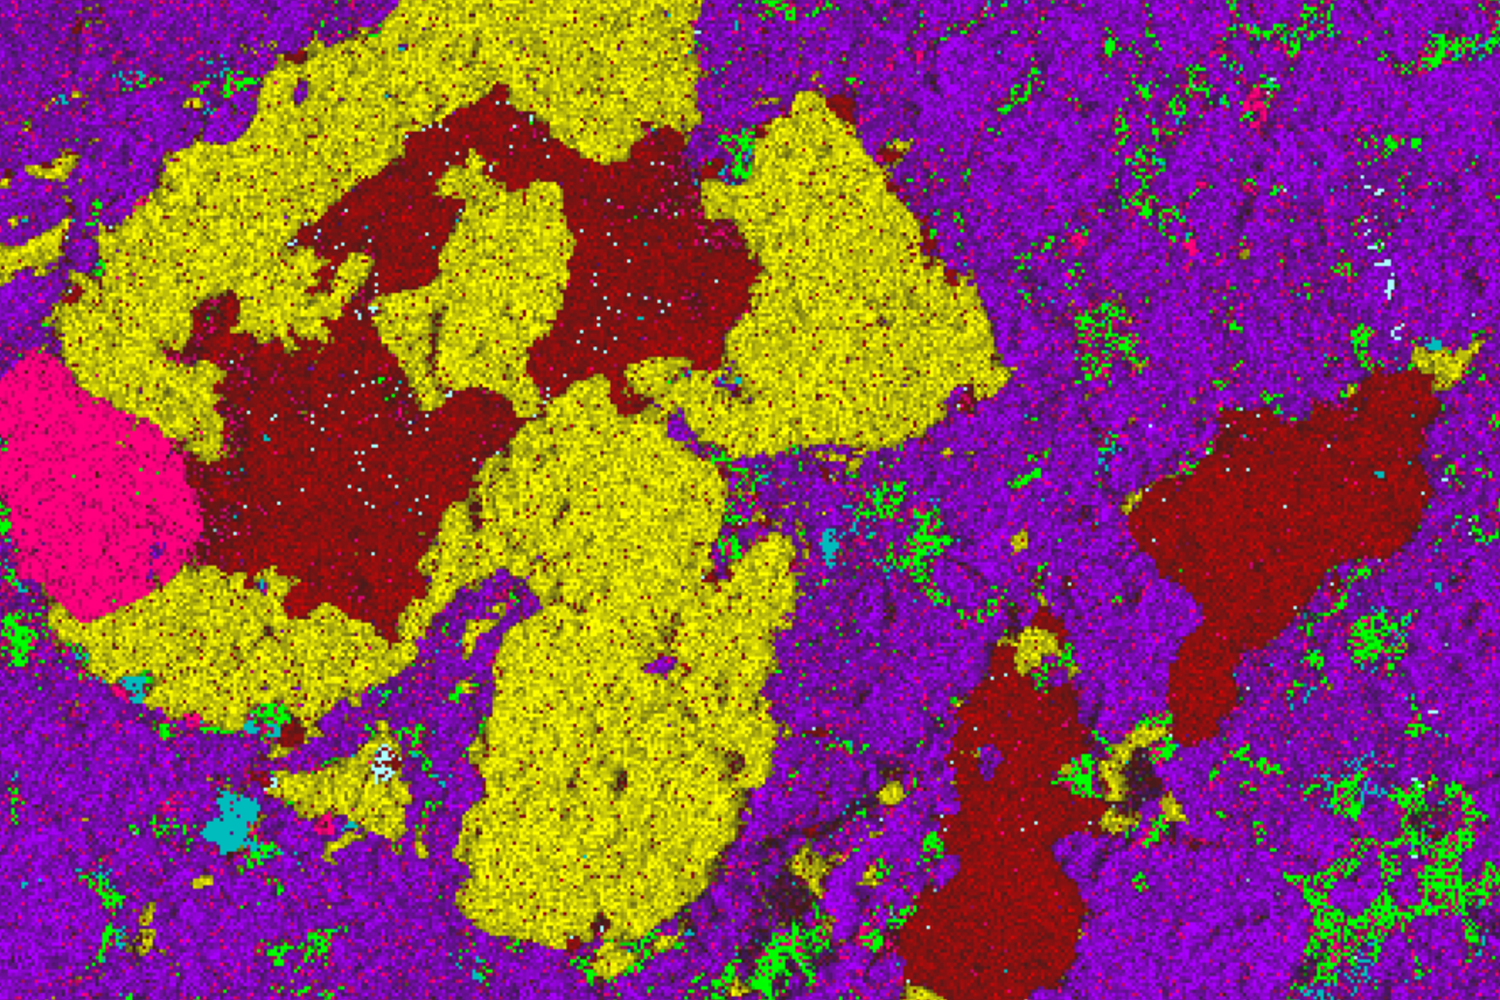
ChemiPhase (phase mapping) is an advanced analysis tool that goes beyond standard EDS mapping. While EDS shows where individual elements are located, ChemiPhase groups areas with similar elemental compositions to identify distinct phases in a sample. This approach provides a clearer view of the sample’s microstructure, highlighting regions with similar element percentages and offering deepener insights into the material’s properties and behavior.
EDS Detector
Product Knowledgebase
Practical SEM and Ion Mill Applications for Semiconductor R&D to Production
Scanning Electron Microscopes (SEMs) and Cross-sectioning/Polishing tools play a vital rol…
Optical Microscopy vs SEM for Technical Cleanliness Analysis
The performance of sensitive systems such as engines, hydraulics, electronics, and medical…
Understanding Nickel Manganese Cobalt (NMC) Precursor Cathode Active Material (pCAM)
As the battery industry strives for more efficient and environmentally friendly solutions…

