Table of Contents
What is Quartz Crystal Microbalance (QCM)?
Molecular adsorption via the vacuum or gas phase typically results in rigid films that are fully coupled to the oscillation of the electrode surface. Hence, the change in mass of such films is linearly related to the change in the oscillation frequency which is defined by a well-known equation called the Sauerbrey Equation. The QCM can provide useful information on the amount of mass deposited and the rate of deposition (or removal) of such films by monitoring the real-time change in frequency.1-2 In the liquid environment, however, molecular adsorption includes contributions from associated liquid molecules as an additional dynamic mass via direct hydration/solvation and/or entrapment within the adsorbed film. Adsorption can produce soft, or viscoelastic films and the resulting layer may not fully couple to the oscillating crystal. This can lead to dampening, or energy loss, of the oscillation. The mass of such films cannot be determined accurately by measuring the frequency change alone. Both frequency change (Δf) and energy loss (measured as dissipation change, ΔD) need to be measured to accurately determine the mass change of a viscoelastic film. Furthermore, by monitoring both Δf and ΔD, additional structural information (e.g., conformational changes in the film, crosslinking, and swelling) can be obtained. This technique is called Quartz Crystal Microbalance with Dissipation (QCM-D).4
QCM-D also provides real-time information on the viscoelastic properties of the adsorbed film, such as viscosity, elasticity, and density. The maximum mass sensitivity of the technique in liquid is less than 1 ng/cm2. The maximum film thickness that can be measured varies from several hundred nanometers to a few microns, depending on the rigidity of the film. QCM-D has a wide range of applications in various fields of science. Some examples include: kinetics of molecular interactions (e.g., protein-protein interactions), molecule-surface interactions (e.g., affinity of bio-molecules to the binding site of a functionalized surface), buildup of polymer films and their interactions with different constituents of liquid media, effect of surfactants on various coatings, biosensor applications, etc.5-10
Theory and Instrumentation
Quartz: A piezoelectric resonator
The operation of QCM is based on the piezoelectric effect that occurs in crystalline materials of certain crystallography known as “acentric” materials,11-12 Quartz belongs to this class of crystals. The word piezoelectricity is derived from the Greek word “piezein”, which means “to press”, and the electricity that is generated in response to applied pressure in these types of materials. Piezoelectricity is defined as the generation of electricity in response to the mechanical deformation caused by mechanical stress or as the generation of physical deformation on the application of electricity in such crystals. The French physicists Pierre and Jacques Curie discovered this effect in 1880 when they demonstrated that salt crystals could produce electricity when deformed along certain crystallographic orientations.11 A year later they demonstrated that the converse effect was also possible, i.e., the quartz could deform upon the application of voltage.
Quartz, besides being piezoelectric, also possesses a unique combination of properties that make it an ideal candidate for ultrasensitive devices. It is found in abundance in nature, and it is easy to grow and process. In addition, α-quartz, the phase of quartz that can be used as a resonator, is thermodynamically stable up to 573 °C.
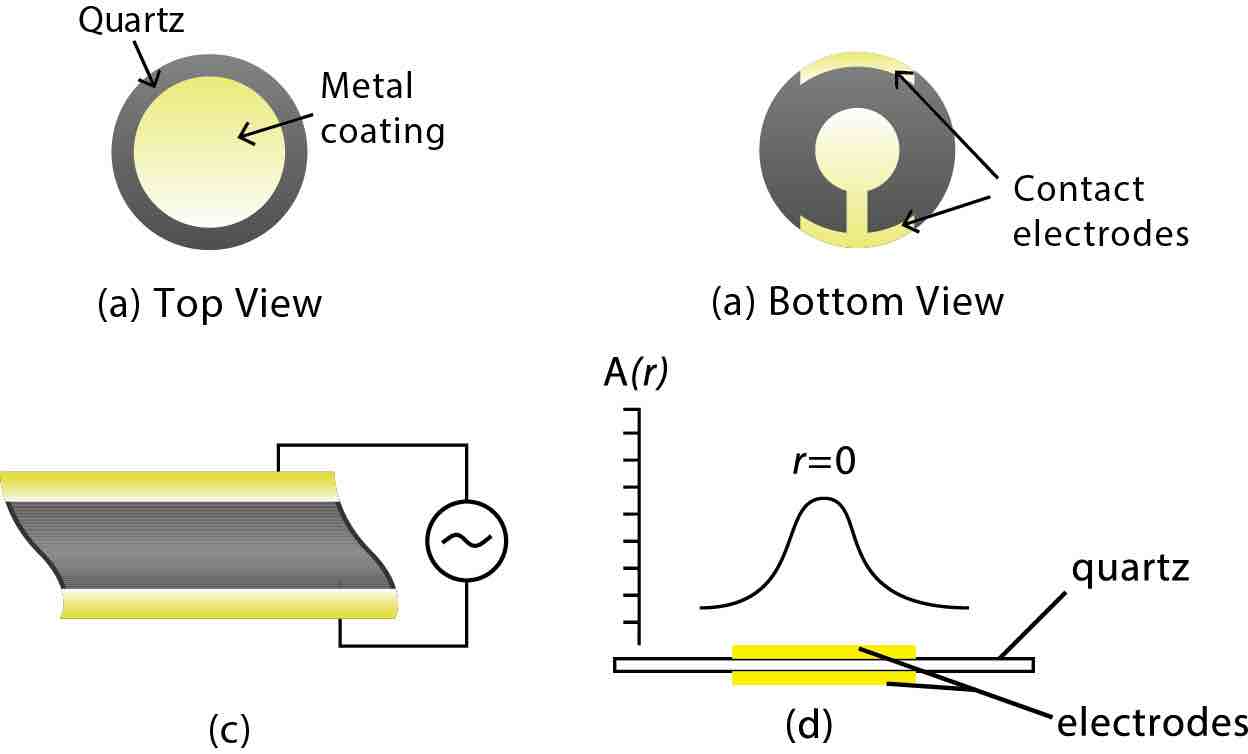
To fabricate quartz crystal resonators, wafers are cut from the bulk quartz crystal at specific orientations with respect to the crystallographic axis. The quartz discs used in QCMs are most commonly processed using the “AT cut” that provides pure thickness shear mode oscillation where the two surfaces of the crystal move in an anti-parallel fashion.13 After cutting, a pair of metal electrodes (usually gold) is directly evaporated on the top and bottom surfaces of the quartz disc (Figure 1). When the corresponding alternating current is applied to the quartz disc, it will oscillate at its resonance frequency. The resonance frequencies are typically on the order of MHz and inversely proportional to the crystal thickness. The common 5 MHz quartz crystal has a corresponding thickness of approximately 330 µm.
AT-cut crystals are designed to have good stability at room temperature (25 °C), i.e., minimum frequency change (1-3 Hz/°C). The effects of temperature on frequency for various angle cuts are well known and documented.2,14-16 However, this near-zero temperature coefficient can increase when crystals are immersed in liquid. The coupling of the shear mode oscillation with the temperature-dependent viscosity of the liquid can increase the temperature coefficient to approximately 8 Hz/°C for water. Therefore, careful control of temperature (to <=0.1°C) surrounding the crystal, or accurate measurement accompanied by compensation, is required for high accuracy measurements with QCM.
Mass Sensitivity of QCM: Sauerbrey equation
The frequency change in QCMs can be measured with a resolution of 1 Hz or less on crystals with a fundamental resonance frequency in the MHz range. Because of its high stability as a resonator, quartz crystals were successfully incorporated, in the early 1900s, as components in various devices such as electronic filters, frequency control devices, and ultrasonic transducers.17-18 The application of quartz crystals as sensitive mass balances was realized in the late 1950s following the pioneering work of Sauerbrey. Sauerbrey demonstrated, in 1959, that the frequency change (Δf) of oscillating quartz could be linearly related to its mass change (Δm) as expressed by:
Δm = -C * 1/n * Δf
Equation 1
where n is the overtone number and C is a constant that depends on the property of the crystal used. Equation 1, typically referred to as the Sauerbrey equation, constitutes the basic principle of QCM technology.2 For a 5 MHz AT-cut quartz crystal at room temperature, C is approximately equal to 17.7 ng/(cm2·Hz). This means that the addition of 17.7 ng/cm2 of mass on a 5 MHz quartz crystal causes a frequency change of 1 Hz. The frequency of 5 MHz quartz can be easily measured with a precision of 0.01 Hz in a vacuum; therefore, measurement of nanogram-scale masses can be achieved. For example, the corresponding frequency shift on the addition of a monolayer of water with an areal density of approximately 25 ng/cm2 to the surface of an AT-cut quartz crystal is approximately 1.4 Hz and well within the limits of detection. In 1963, Warner and Stockbridge demonstrated the measurement of a change in mass as small as 1 pg/cm2 that corresponded to about 0.1 % of a monolayer of hydrogen.19
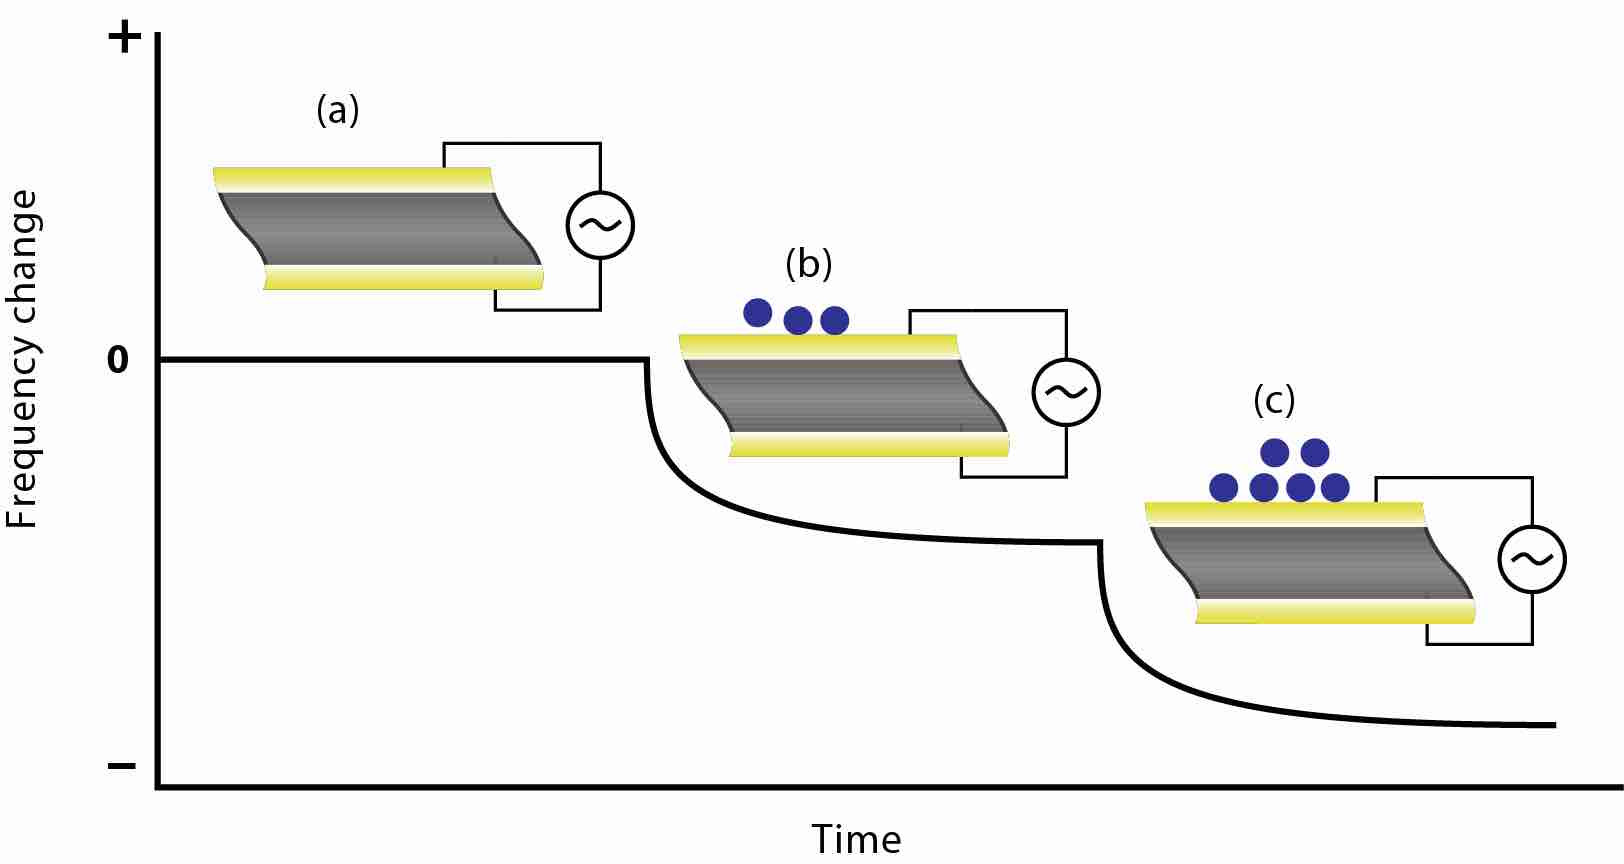
Sauerbrey developed Equation 1 assuming that a small mass added to the crystal can be treated as an equivalent change in the mass of the quartz crystal itself. This means that the equation is only valid when the added mass is rigidly adsorbed on the quartz surface with no slip. Sauerbrey’s finding is schematically depicted in Figure 2. Sauerbrey continued his investigation of the mass sensing properties of the QCM and later demonstrated that the crystal vibration is restricted to the area where the electrodes overlap as illustrated in Figure 1d. This area of vibration is called the active area of the crystal. The amplitude of vibration, A(r), peaks in the center of the electrode, r = 0, and tapers off in a Gaussian fashion towards the edges of the electrodes (Figure 1d). This differential mass sensitivity of the quartz surface area constitutes another limitation for the Sauerbrey equation, namely, that the mass must be evenly distributed over the active area.
In summary, the Sauerbrey equation is valid under the following three conditions: (i) the added mass is small compared to the mass of the crystal itself, (ii) the added mass is rigidly adsorbed, and (iii) the mass is evenly distributed over the active area of the crystal. This equation has been used and is still being used in several industries for monitoring the rate and thickness of metal deposition under the vacuum or gas phase.
The development of a QCM that could be operated in liquid media was the next step in advancing its applications. However, the task posed several challenges to early researchers. It wasn’t until 1980 that Nomura and Hattori demonstrated that a quartz crystal completely submerged in liquid media could be oscillated at stable frequencies.20
Quartz Crystal Microbalance with Energy Dissipation (QCM-D)
With the invention of liquid media QCM,20 the applications for QCM extended widely in the fields of biology, biotechnology, polymers, lipids, proteins, electrochemistry, environmental studies, nanoparticles, etc. The interaction of the QCM crystal surface with these flexible molecular systems results in the formation of soft, or viscoelastic, films that violate Sauerbrey’s condition that the bound mass be rigidly attached to the crystal surface without any slip. Such viscoelastic films cause dissipation of oscillation energy due to mechanical losses in the flexible mass. The linear relationship between the frequency and mass, as defined by Sauerbrey, fails for viscoelastic films. Hence, it is important to take dissipation into account when quantifying viscoelastic mass. Dissipation is defined as the inverse of the crystal’s quality factor, Q, as expressed by:
D = 1/Q = Edissipation / (2π * Estored)
Equation 2
Where Edissipation is the energy dissipated in one cycle and Estored is the energy stored in the oscillating system.
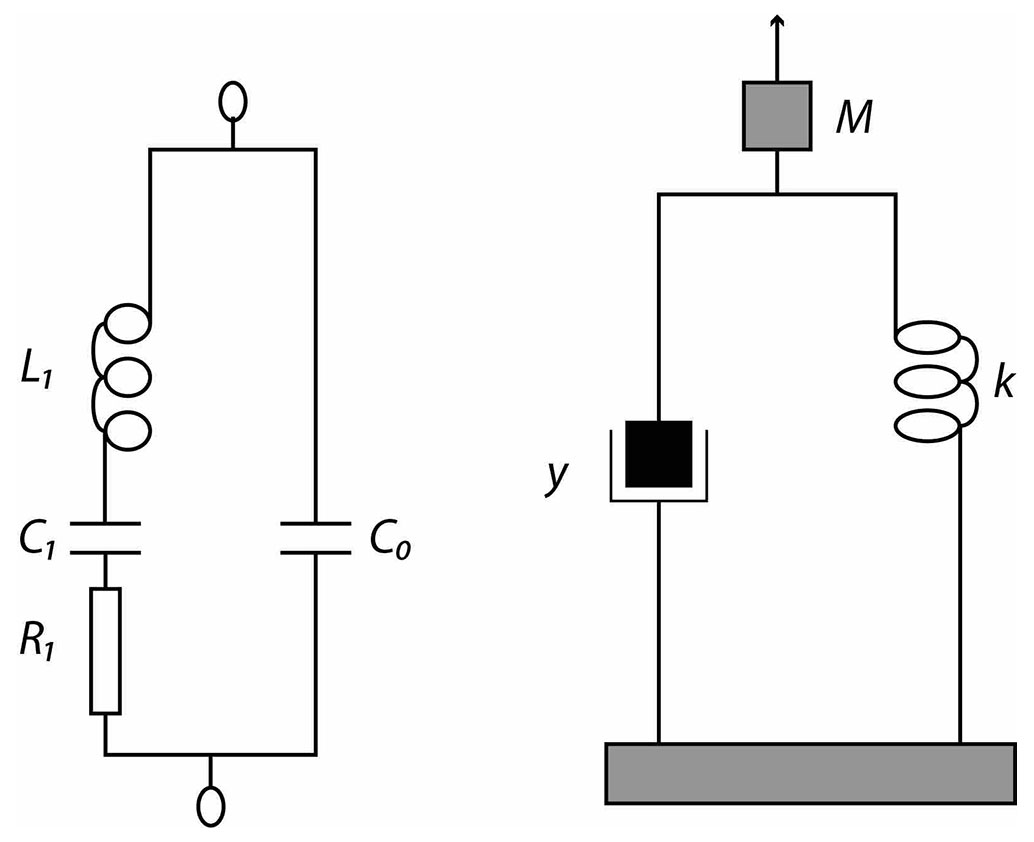
The energy dissipation in the electrical circuit model can be defined as
D = 1/Q = R1 / (2π * f * L1)
Equation 3
where f refers to frequency. The two most common approaches that use the electrical circuit model for measuring energy dissipation, are resistance analysis (QCM-R) and impedance analysis (QCM-Z).
In QCM-R, the resistance of the crystal can be measured by introducing a small resistor into the circuit and measuring the voltage. If the shunt capacitance, C0, has been canceled, the measured current of the resonating crystal’s equivalent circuit will be proportional to crystal resistance, R1, which is the sum of losses. This approach, however, doesn’t provide an absolute value because L1 is not known in this type of measurement. Also, the true cancellation of C0 may not be achieved if the crystal is significantly loaded. For these reasons the resistance approach provides relative structural data.
The QCM-Z is a more defined approach for measuring energy losses. In this method, all four elements of the crystal’s equivalent circuit can be determined by impedance analysis.23-24 The setup includes a frequency generator that provides varying input frequencies to the equivalent circuit. The current and phase are recorded at each frequency of the frequency sweep, allowing all four components, L1, C1, R1 and C0, to be numerically fitted. The limitation of this approach is that the fitting of the equivalent circuit works only when the crystal is in a steady state. The crystal needs to be stabilized at each frequency step; therefore, the data acquisition rate with this method is considerably slower as compared to other QCM methods.
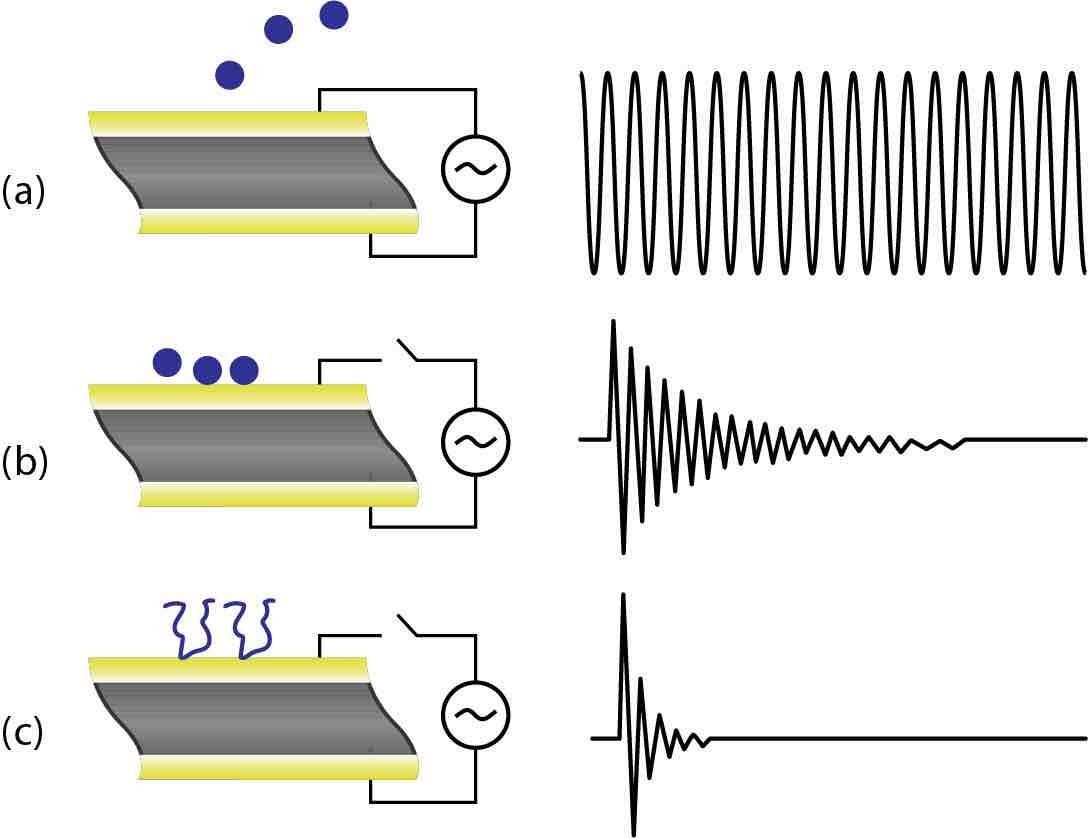
A third approach that is gaining increasing popularity is QCM-D. In this method, the quartz crystal is excited to its resonance frequency for a short period by applying a driving voltage. The driving voltage is then turned off and the voltage decay over the crystal is recorded as a function of time.4 The voltage over the crystal decays as an exponentially dampened sinusoidal wave as given by:
A(t) = A0 et/τ sin(2πft + φ)
Equation 4
where A is amplitude, τ is the decay time constant, f is frequency and φ is the phase angle. The decay time constant is related to the dissipation factor by
D = 1 / (2πfτ)
Equation 5
Therefore, by numerically fitting the decay curve to Equation 4 both frequency and dissipation of the crystal can be obtained simultaneously. The decay time constant depends on the rigidity or softness of the mass adsorbed on the crystal surface. For example, rigid materials (e.g., metal films) couple well with the oscillating quartz, and, when the driving voltage is turned off, the oscillation takes longer to decay. In other words, the decay curve will be longer (Figure 4b). On the other hand, if the adsorbed mass is soft or viscoelastic, such as proteins, lipids, etc., it’s coupling with the oscillating quartz is poor. The flexible viscoelastic mass dampens the crystal oscillation causing it to decay faster, i.e., the decay curve will be shorter (Figure 4c).
Viscoelastic Model
Dampening introduces energy losses in the system. The frequency and dissipation responses, in this case, are a function of the film properties such as density, thickness, viscosity and shear modulus (elasticity). Therefore, measurement of both frequency and dissipation are required for accurate calculation of the viscoelastic mass (as the product of density and thickness) and can also be used to obtain the viscoelastic properties of the adsorbed film. This analysis is performed by fitting the frequency and dissipation responses to a viscoelastic (e.g., Voigt, Figure 3b) model, as explained by Voinova et al.25 The Voigt viscoelastic model consists of the arrangement of a (viscous) dashpot and (elastic) spring in parallel. A schematic representation of the layered structure of quartz coated with a viscoelastic film in bulk liquid is provided in Figure 5.
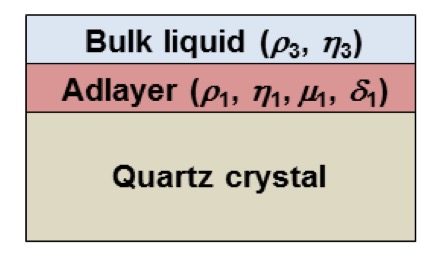
Voinova et al described that frequency (Δf) and dissipation (ΔD) responses of the quartz crystal, upon adsorption of a viscoelastic film in liquid medium as illustrated in Figure 5, can be related to the viscoelastic properties of the adsorbed layer and the bulk properties of the liquid by:
Δf |
≈ |
1 |
{ |
η3 |
+ δ1ρ1ω – 2δ1 ( |
η3 |
) |
2 |
η1ω2 |
} |
||
2πρ0δ0 |
δ3 |
δ3 |
μ12 + ω2η12 |
|||||||||
Equation 6
and
ΔD |
≈ |
1 |
{ |
η3 |
+ 2δ1 ( |
η3 |
) |
2 |
η1ω |
} |
||
πfρ0δ0 |
δ3 |
δ3 |
μ12 + ω2η12 |
|||||||||
Equation 7
Where ρ0 and δ0 are the density and thickness of the quartz crystal, η3 and ρ3 are the viscosity and density of the bulk liquid, δ3 is the viscous penetration depth of the shear wave in the bulk liquid, and ω is the angular frequency of oscillation. ρ1, η1, µ1, and δ1 are the density, viscosity, shear elasticity and thickness of the adsorbed layer, respectively. Since there are several unknown parameters to identify, Δf and ΔD are needed from at least two overtones of the fundamental frequencies to apply this model.
The Δf/n and ΔD/n responses for various harmonics (n) of a viscoelastic film on quartz do not overlay. By contrast, for a rigid film where the Sauerbrey equation is used, these responses would tend to overlap at all harmonics. The harmonic dependencies of the measured Δf and ΔD responses and large magnitudes of dissipation changes are the main characteristics of viscoelastic films and as such should be modeled using the Voigt model. The ΔDn/Δfn ratio is another criterion to decide whether the adsorbed film is viscoelastic or rigid. Theoretically, the film should be considered viscoelastic when the dissipation is greater than zero. However, some researchers have suggested certain ΔDn/Δfn ratios as guidelines to approximate whether the film is viscoelastic or rigid. For example, Cho et al.26 suggested that the ΔDn/Δfn ratio for a viscoelastic film is greater than 0.1×10⁻⁷ Hz-1, while Reviakine et al.27 suggested that a film can be considered rigid when the ΔDn/Δfn ratio is much less than 4×10⁻⁷ Hz-1.
Equipment and Operating Methods
QCM Instrument
The typical QCM system consists of a quartz crystal with electrodes deposited on both the front and back sides, a crystal holder to secure the crystal and provide electrical connection, an oscillator which drives the crystal to its resonance frequency, and a controller or monitor that reads the frequency change and stores process parameters (Figure 6). The electrodes at the front and the back of the crystal usually are key-hole shaped (Figure 1), and the resonator maybe thicker in the center than at the edge. Such electrode design allows the QCM to oscillate only in the central area where electrodes are deposited.28 The motion wave generated as a result of crystal oscillation is focused in the center of the quartz crystal which makes it easier to mount the crystal at the edge without excessive dampening of oscillation (Figure 1d).
Since the oscillation frequency stability is affected by temperature changes, the quartz crystal holder is usually placed in an enclosed, temperature-controlled chamber. The chamber is customizable for measurements in either air/vacuum or liquid media. The base components of a QCM are relatively inexpensive and, as such, can be assembled in-house. Many of the developments and features that exist in today’s commercial QCM instruments were pioneered in laboratories with custom-built instruments to meet specific research needs, such as the use of internal reference crystals to separate the effects of liquid environment from those of a film sample.29-30

Today, while custom-built QCMs are still popular to tailor to specific experiments, several commercial QCMs, each with different instrument specifications, are available on the market. Some QCMs are only operated in either vacuum or gas, where the deposited film is thin and rigid, and typically use the Sauerbrey equation for monitoring film thickness. As the film thickness increases, the viscoelastic effect comes into play and can affect the resonance properties of the crystal.
QCM-D Instrument
For QCMs that are operated in liquid media, the contribution of the viscoelastic effect is even stronger driven primarily by the density and viscosity if the liquid itself. Therefore, additional measures are taken to overcome the consequences of large dampening for liquid-based QCMs. QCM-D is one such technology that has gained popularity over recent years. QCM-D enables the measurement of energy loss by recording the oscillation decay curve after briefly exciting the quartz crystal to its resonance frequency and turning the drive voltage off (as described above and depicted in Figure 4). The decay curve (i.e., the amplitude of the output voltage of a freely oscillating crystal as a function of time) is obtained by mixing the resonant frequency of the sample crystal (f0) with a reference frequency (fR) and then filtering it by a low pass band filter. 4 The difference between the f0 and fR gives the output frequency that is denoted as f in Equations 4 and 5.
The entire process of excitation of the quartz crystal and recording and fitting of the decay curve occurs on the millisecond timescale. Therefore, real-time data acquisition is achievable with the QCM-D approach. QCM-D also enables the data acquisition at multiple overtones of a crystal’s fundamental resonance frequency. These parameters allow analysis of the experimental data by various modeling theories to obtain information including adsorbed mass, thickness, density, shear elasticity (also sometimes called shear modulus), viscosity, and kinetics of the viscoelastic film. 25, 31-32 The real-time characterization and kinetics analysis of the molecular interactions taking place at the crystal surface (adsorption, reaction, desorption, etc.) is possible due to the fast data acquisition with QCM-D.
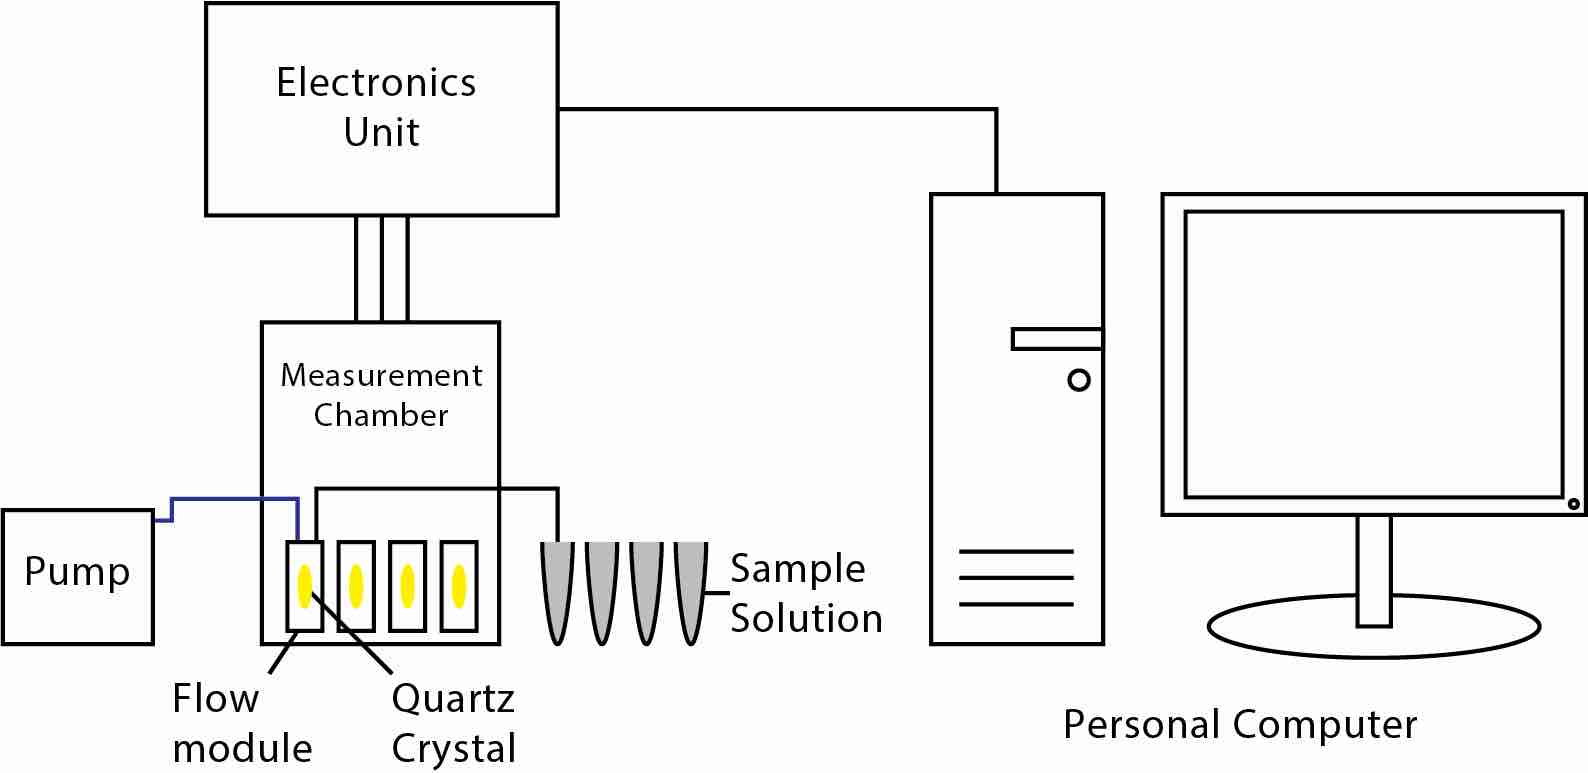
A basic QCM-D instrument includes a quartz crystal with electrodes deposited on both front and back side, a flow module that holds the quartz crystal and enables liquid media to flow across the top face of the crystal, a pump to flow the sample solution, a temperature controlled chamber where the flow module is mounted and held at a set temperature, and an electronics unit that drives the crystal by applying appropriate voltage and recording the frequency and dissipation changes. One of the most common QCM-D instrument models contains four flow modules (see Figure 7), each holding a quartz crystal, and enables simultaneous measurements of frequency and dissipation changes of up to four QCM-D sensors at the same time.
Electrochemical Quartz Crystal Microbalance with Dissipation Monitoring (EQCM-D)
Electrochemical quartz crystal microbalance with dissipation (EQCM-D) has emerged as a powerful in situ technique to complement electrochemical experiments. Quartz crystal microbalance with dissipation (QCM-D) is a highly sensitive surface technique that monitors real-time changes occurring at surfaces with nano-level sensitivity. When combined with electrochemistry, it can provide information on mass and structural changes associated with electron transfer processes occurring at the electrode surface, such as electropolymerization, ion intercalation, corrosion, and electrodepostion. The unique ability of the QSense QCM-D technology to measure data at multiple harmonics has enabled characterization of rough/porous Li- ion battery electrodes on a mesoscopic scale (ref 5-8).
The QSense electrochemistry (EC) module (QEM 401) facilitates simultaneous QCM-D and electrochemistry measurements on the same surface. The EQCM-D setup offers great flexibility for conducting experiments under different conditions, for example, experiments can be performed in organic solvents and other harsh media. The entire EQCM-D set-up can be placed in a glove box using appropriate connectors. QSense offers a wide variety of sensor surfaces as electrode mimics. Customized sensor surfaces can be prepared to meet user’s requirements.
EQCM-D Experimental Set-up
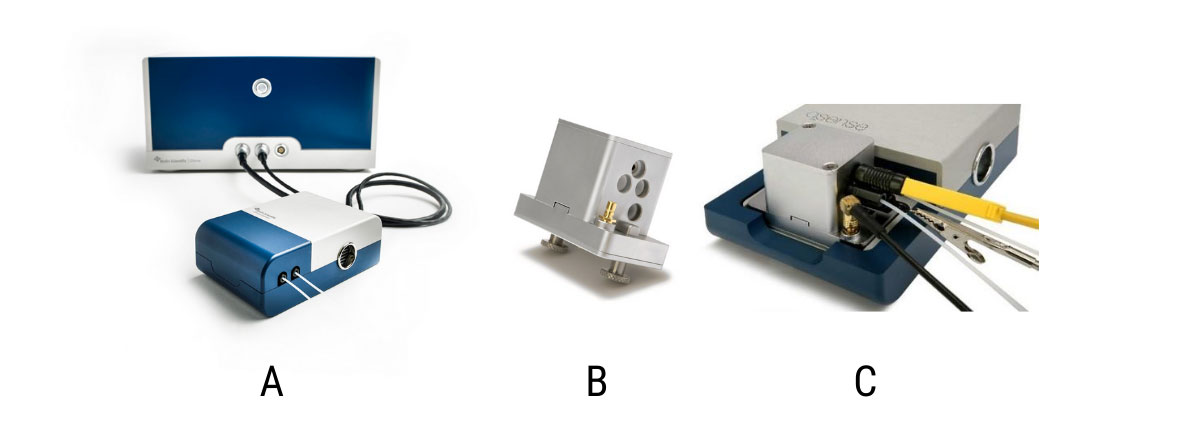
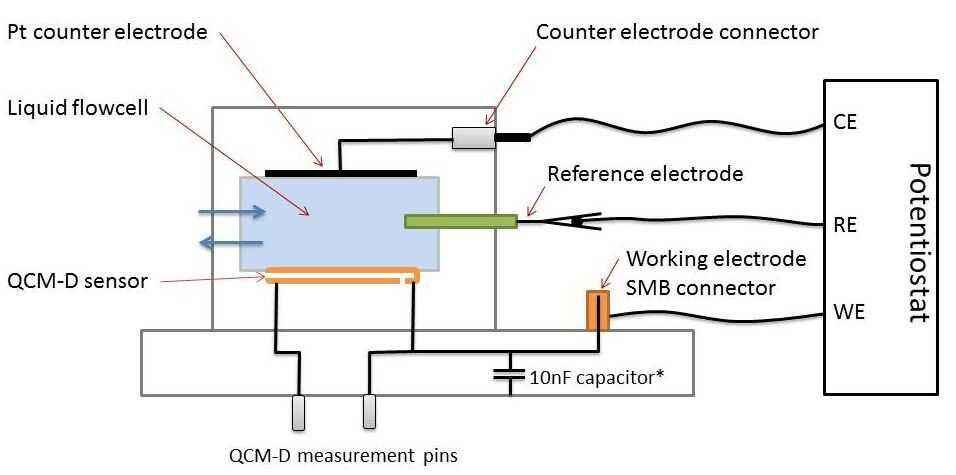
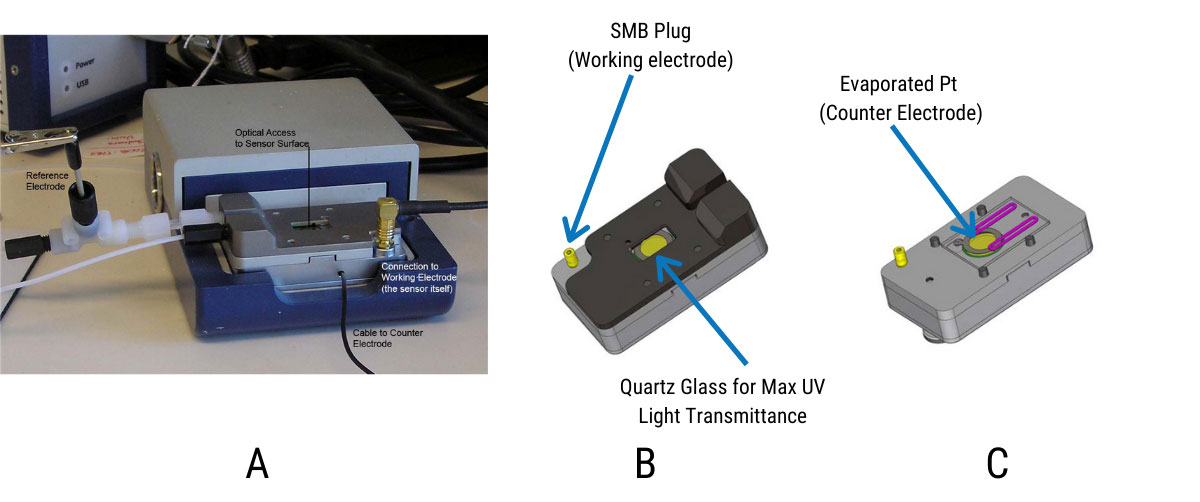
Figure 8 shows pictures of the QSense Explorer (Figure 8A), QSense EC module QEM 401 (Figure 8B) and the QSense Explorer chamber with EC module mounted on it (Figure 8C). QSense EC module comes in a three-electrode configuration, where the sensor surface acts as the working electrode, a Pt plate is the counter electrode, and a customized low leak Ag/AgCl electrode is used as the reference electrode. It is possible to configure the module with a custom reference electrode for use with organic solvents. The module can also be used in a two-electrode configuration by sealing off the reference electrode port with the Teflon cap provided. Three of the ports shown in Figure 8B are used to connect the three electrodes with the potentiostat. The two other ports are connected to inlet and outlet tubing and experiments can be operated in either flow or batch modes (Figure 8C).
The schematics in Figure 9 provides a detailed diagram of this setup; the QSense sensor mounted at the bottom serves as the working electrode; any changes happening at the surface in the electrochemical environment are measured in real time by monitoring the frequency (f) and dissipation (D) changes of the sensor crystal using QCM-D. The Pt ceiling acts as the counter electrode, and the reference electrode is mounted in the outlet flow close (~4-5 mm) to the working electrode.
QSense Window EC module, QWEM-401
For light sensitive electrochemistry (EC) experiments, Biolin Scientific provides a Window EC module (QWEM 401) equipped with a 1 mm thick sapphire glass window that allows optical access to sensor surface (Figure 10B). Onto the glass of the window EC module, a platinum ring electrode has been sputtered, which acts as the counter electrode (CE) (Figure 10C). The top electrode of the sensor acts as working electrode (WE). The reference electrode (RE) is placed in the outlet flow path.
The EQCM-D set-up allows combining QCM-D measurements with typical electrochemical experiments such as, cyclic voltammetry (CV), amperometry, voltammetry and electrochemical impedance spectroscopy (EIS).
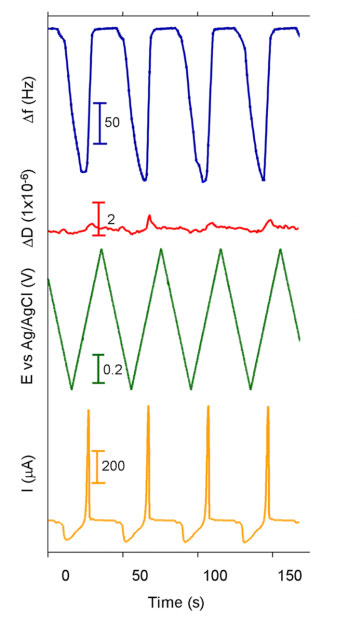
Figure 11 shows example QCM-D and EC data collected during copper plating and stripping onto a QSense gold sensor in response to voltage cycling from +0.3 V to -0.5V at 50 mV/s 4 times. Copper sulfate solution (10 mM CuSO4 in 0.1 M H2SO4) was used as electrolyte. The decrease in ∆f indicates mass building up on the surface while the increase in ∆D indicates the film’s viscoelastic character. Dissipation, in this case is relatively low compared to the change in ∆f indicating that the copper film was rigidly adsorbed to the surface. The copper plating and stripping process was reversible (Data is obtained from Biolin Scientific).
References
[1] C. Lu and A.W. Czanderna, Applications of Piezoelectric Quartz Crystal Microbalances, Elsevier Science Publishers B.V., Amsterdam, NL, 1984.
[2] G. Sauerbrey, Verwendung von Schwingquarzen zur Wägung dünner Schichten und zur Mikrowägung, Zeitschrift für Physik, 155 (2), 206-222 (1959).
[3] T. Nomura and A. Minemura, Behavior of a piezoelectric quartz crystal in an aqueous solution and the application to the determination of minute amount of cyanide, Nippon Kagaku Kaishi, 10, 1621-1625 (1980).
[4] M. Rodahl and B. Kasemo, A simple setup to simultaneously measure the resonant frequency and the absolute dissipation factor of a quartz crystal microbalance, Review of Scientific Instruments, 67 (9), 3238-3241 (1996).
[5] M.A. Cooper and V.T. Singleton, A survey of the 2001 to 2005 quartz crystal microbalance biosensor literature: applications of acoustic physics to the analysis of biomolecular interactions, Journal of Molecular Recognition, 20 (3), 154-184 (2007).
[6] M.C. Dixon, Quartz crystal microbalance with dissipation monitoring: enabling real-time characterization of biological materials and their interactions, Journal of Biomolecular Techniques, 19 (3), 151 (2008).
[7] P.L. Konash and G.J. Bastiaans, Piezoelectric crystals as detectors in liquid chromatography, Analytical Chemistry, 52 (12), 1929-1931 (1980).
[8] Y. Liu, A. Jaiswal, et al., Surface Plasmon Resonance and Quartz Crystal Microbalance Methods for Detection of Molecular Interactions, in Chemosensors: Principles, Strategies, and Applications. Wang B. and Anslyn E.V., (Eds), 2011.
[9] A. Janshoff, H.J. Galla, and C. Steinem, Piezoelectric mass-sensing devices as biosensors – An alternative to optical biosensors?, Angewandte Chemie-International Edition
[10] B. Becker and M.A. Cooper, A survey of the 2006-2009 quartz crystal microbalance biosensor literature, Journal of Molecular Recognition, 24 (5), 754-787 (2011).
[11] W.G. Cady, Piezoelectricity: an introduction to the theory and applications of electromechanical phenomena, Dover Publications, New York, USA, 1964.
[12] M.D. Ward and D.A. Buttry, In situ interfacial mass detection with piezoelectric transducers, Science, 249 (4972), 1000-1007 (1990).
[13] F. Lack, G. Willard, and I. Fair, Some improvements in quartz crystal circuit elements, Bell System Technical Journal, 13 (3), 453-463 (1934).
[14] L. Bradshaw, Understanding Piezoelectric Quartz Crystals, RF Design, 23, 50-59 (2000).
[15] “Quartz Crystal Microbalance Theory and Calibration.” http://www.thinksrs.com (accessed April).
[16] “RQCM- Research Quartz Crystal Microbalance: Operation and Service Manual,” Inficon; East Syracuse, NY, USA, 2007.
[17] V.E. Bottom, A history of the quartz crystal industry in the USA, Proceedings of the 35th Annual Frequency Control Symposium, 3-12 (1981).
[18] D. Sullivan, Time and frequency measurement at NIST: The first 100 years, Proceedings of the IEEE International Frequency Control Symposium and PDA Exhibition, 4-17 (2001).
[19] A.W. Warner and C.D. Stockbridge, Quartz Resonators; Reduction of Transient Frequency Excursion Due to Temperature Change, Journal of Applied Physics, 34 (2), 437-438 (1963).
[20] T. Nomura and O. Hattori, Determination of micromolar concentrations of cyanide in solution with a piezoelectric detector, Analytica Chimica Acta, 115, 323-326 (1980).
[21] D.A. Buttry and M.D. Ward, Measurement of interfacial processes at electrode surfaces with the electrochemical quartz crystal microbalance, Chemical Reviews, 92 (6), 1355-1379 (1992).
[22] J. Janata, Principles of chemical sensors, Plenum Press, New York, USA, 1989.
[23] A. Janshoff, J. Wegener, et al., Double-mode impedance analysis of epithelial cell monolayers cultured on shear wave resonators, European biophysics journal, 25 (2), 93-103 (1996).
[24] J. Wegener, J. Seebach, et al., Analysis of the composite response of shear wave resonators to the attachment of mammalian cells, Biophysical journal, 78 (6), 2821-2833 (2000).
[25] M.V. Voinova, M. Rodahl, et al., Viscoelastic Acoustic Response of Layered Polymer Films at Fluid-Solid Interfaces : Continuum Mechanics Approach, Physica Scripta, 59, 391-396 (1999).
[26] N.-J. Cho, C.W. Frank, et al., Quartz crystal microbalance with dissipation monitoring of supported lipid bilayers on various substrates, Nature Protocols, 5 (6), 1096-1106 (2010).
[27] I. Reviakine, D. Johannsmann, and R.P. Richter, Hearing What You Cannot See and Visualizing What You Hear : Interpreting quartz crystal microbalance data from solvated interfaces, Analytical Chemistry, 83, 8838-8848 (2011).
[28] V.E. Bottom, Introduction to quartz crystal unit design, Van Nostrand Reinhold, New York, USA, 1982.
[29] S. Bruckenstein, M. Michalski, et al., Dual Quartz Crystal Microbalance Oscillator Circuit. Minimizing Effects due to Liquid Viscosity, Density, and Temperature, Analytical Chemistry, 66 (11), 1847-1852 (1994).
[30] G.C. Dunham, N.H. Benson, et al., Dual Quartz Crystal Microbalance, Analytical Chemistry, 67 (2), 267-272 (1995).
[31] M. Rodahl, F. Höök, et al., Simultaneous frequency and dissipation factor QCM measurements of biomolecular adsorption and cell adhesion, Faraday Discussions, 107, 229-246 (1997).
[32] A. Domack, O. Prucker, et al., Swelling of a polymer brush probed with a quartz crystal resonator, Physical Review E, 56 (1), 680 (1997).

